

As technology advances and our software solutions become more complex, we need to find better ways to ensure the performance, reliability, and security of our systems. This is especially true in today's world, where microservices architectures, micro front-ends, and continuous integration and deployment have become the norm.
- What is Observability and Why it’s so Important in DevOps
- Observability vs. Monitoring
- Pillars Of Observability
- Observability with Prometheus and Grafana
- Hands-On Example
In this context, observability has emerged as a critical capability for organizations to achieve a clear view of what's happening inside their infrastructure and applications. By leveraging observability tools, teams can monitor and analyze system behaviors, detect and diagnose issues, and improve their overall system performance.
Moreover, observability enables organizations to be more proactive in identifying and addressing issues before they become bigger problems. With observability, teams can anticipate any potential problems and resolve them quickly, thus reducing downtime, improving user experience, and delivering better software overall. In this way, observability has become a vital element of modern software development and operations, and organizations that invest in it will undoubtedly reap the benefits of more reliable and performant software systems.
What is Observability and Why it’s so Important in DevOps
Observability is a critical aspect of modern software development and operations that allows businesses to gain valuable insights into the internal state and condition of their systems by analyzing data from external outputs. A highly observable system enables organizations to quickly identify the root cause of performance issues without the need for extensive testing or coding.
In DevOps, observability refers to the software tools and methodologies used by Dev and Ops teams to collect, correlate, and analyze vast amounts of performance data from distributed applications in real-time.
This empowers teams to monitor the application effectively, identify areas for improvement, and enhance the customer experience. By leveraging observability, businesses can deliver more reliable, performant software systems that meet the evolving needs of their customers.
Observability vs. Monitoring
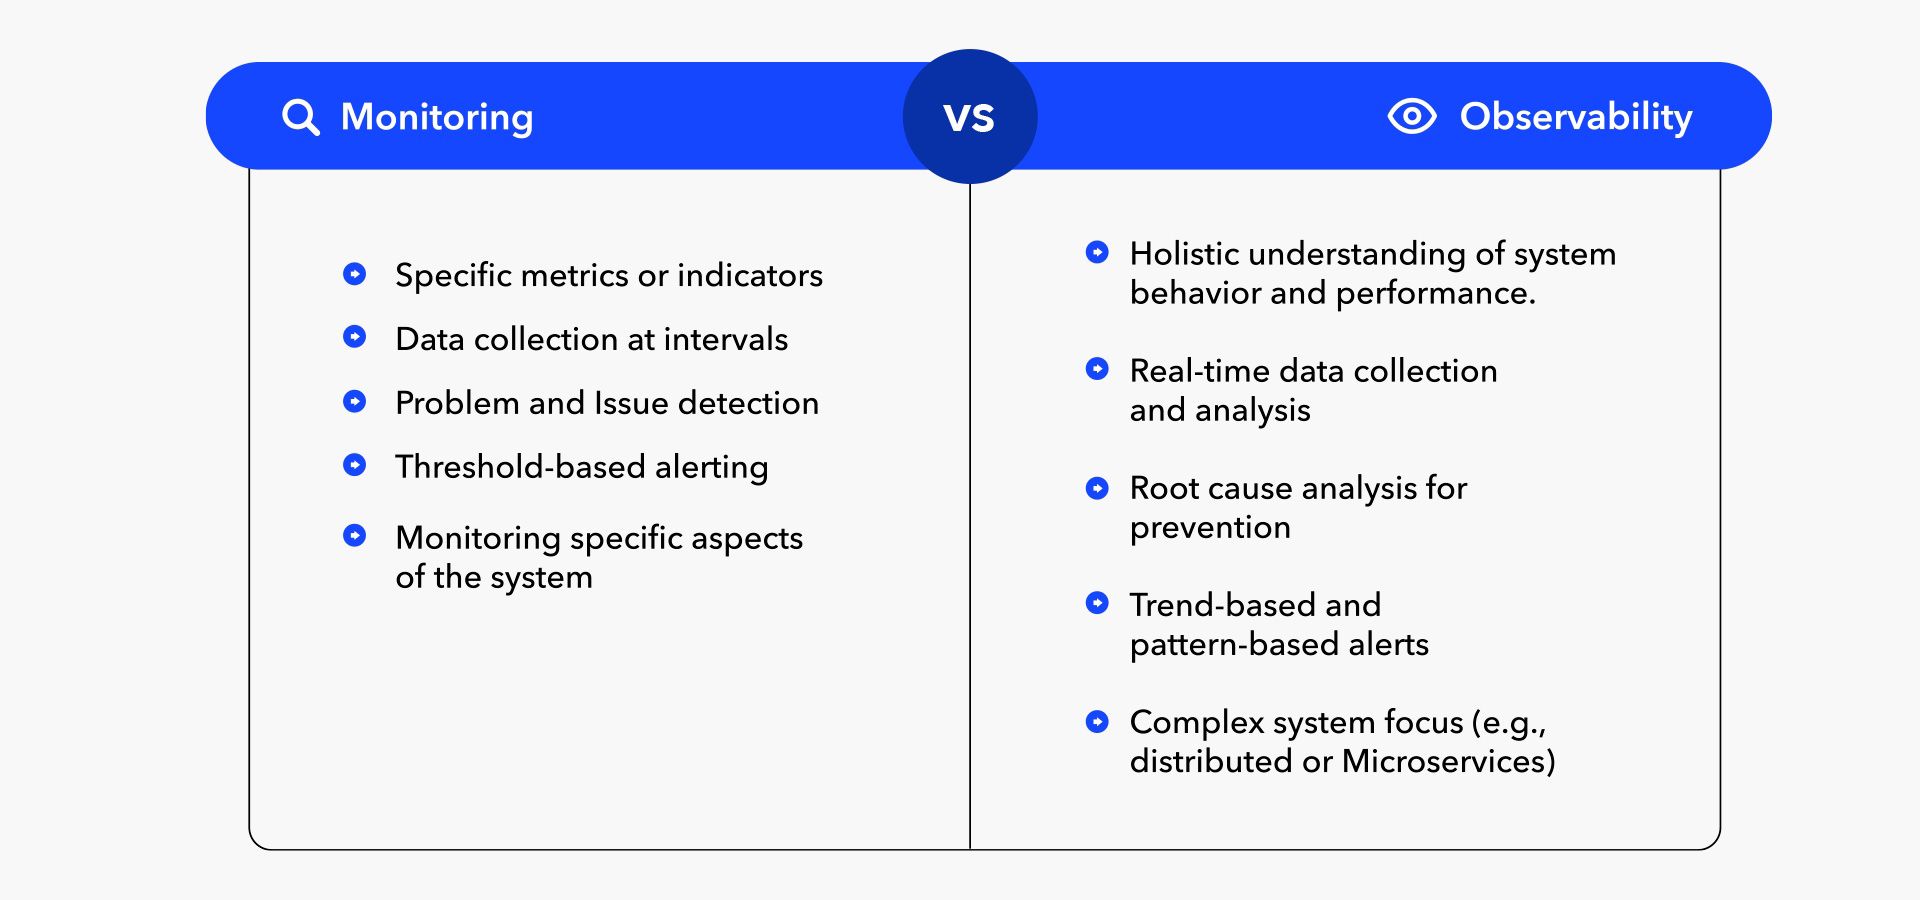
When it comes to understanding the performance and behavior of complex systems, monitoring, and observability are two concepts that are often discussed together. While there are similarities between these two approaches, it's important to understand that they are not the same thing. Here are 5 key differences between them that can help clarify their distinctions:
- Scope: Monitoring is often used to track specific metrics or indicators, such as server response time or CPU utilization. Observability, on the other hand, is about gaining a holistic understanding of how the system is behaving and performing as a whole. This means that observability tools are designed to collect data from a wide range of sources, such as logs, traces, and events, to provide a more comprehensive view of the system.
- Data collection: Monitoring typically involves collecting data at predetermined intervals, such as once per minute or every 5 minutes. This data is then used to generate reports or dashboards that can help teams understand how the system is performing. Observability, on the other hand, is focused on collecting and analyzing data in real-time. This means that observability tools are designed to collect and store large volumes of data quickly and efficiently so that it can be analyzed and acted upon in near real-time.
- Root cause analysis: Monitoring is often used to identify specific issues or problems, such as a server that's running hot or a network connection that's dropped. Observability, on the other hand, is focused on understanding the underlying causes of those issues. This means that observability tools provide more detailed and comprehensive data that can help identify the root cause of a problem, which is critical for preventing similar issues in the future.
- Alerting: Monitoring is often used to trigger alerts when certain metrics or indicators cross predefined thresholds. For example, a server that's running at 90% CPU utilization might trigger an alert. Observability tools, on the other hand, can provide more nuanced alerts based on trends or patterns in the data. This means that observability tools can help identify potential issues before they become critical, allowing teams to take proactive measures to prevent downtime or other issues.
- Complexity: Observability is typically associated with more complex systems, such as distributed or microservices architectures. This is because these types of systems generate a large volume of data that can be difficult to track using traditional monitoring approaches. Observability tools are designed to help teams understand the behavior and performance of complex systems, while monitoring is more focused on specific metrics or indicators that may not provide a complete picture of system behavior.
In summary, while monitoring and observability share many similarities, observability is focused on gaining a holistic understanding of system behavior and performance in real-time, with an emphasis on identifying root causes and preventing future issues. Monitoring, on the other hand, is more focused on tracking specific metrics and triggering alerts when predefined thresholds are crossed.
Pillars Of Observability
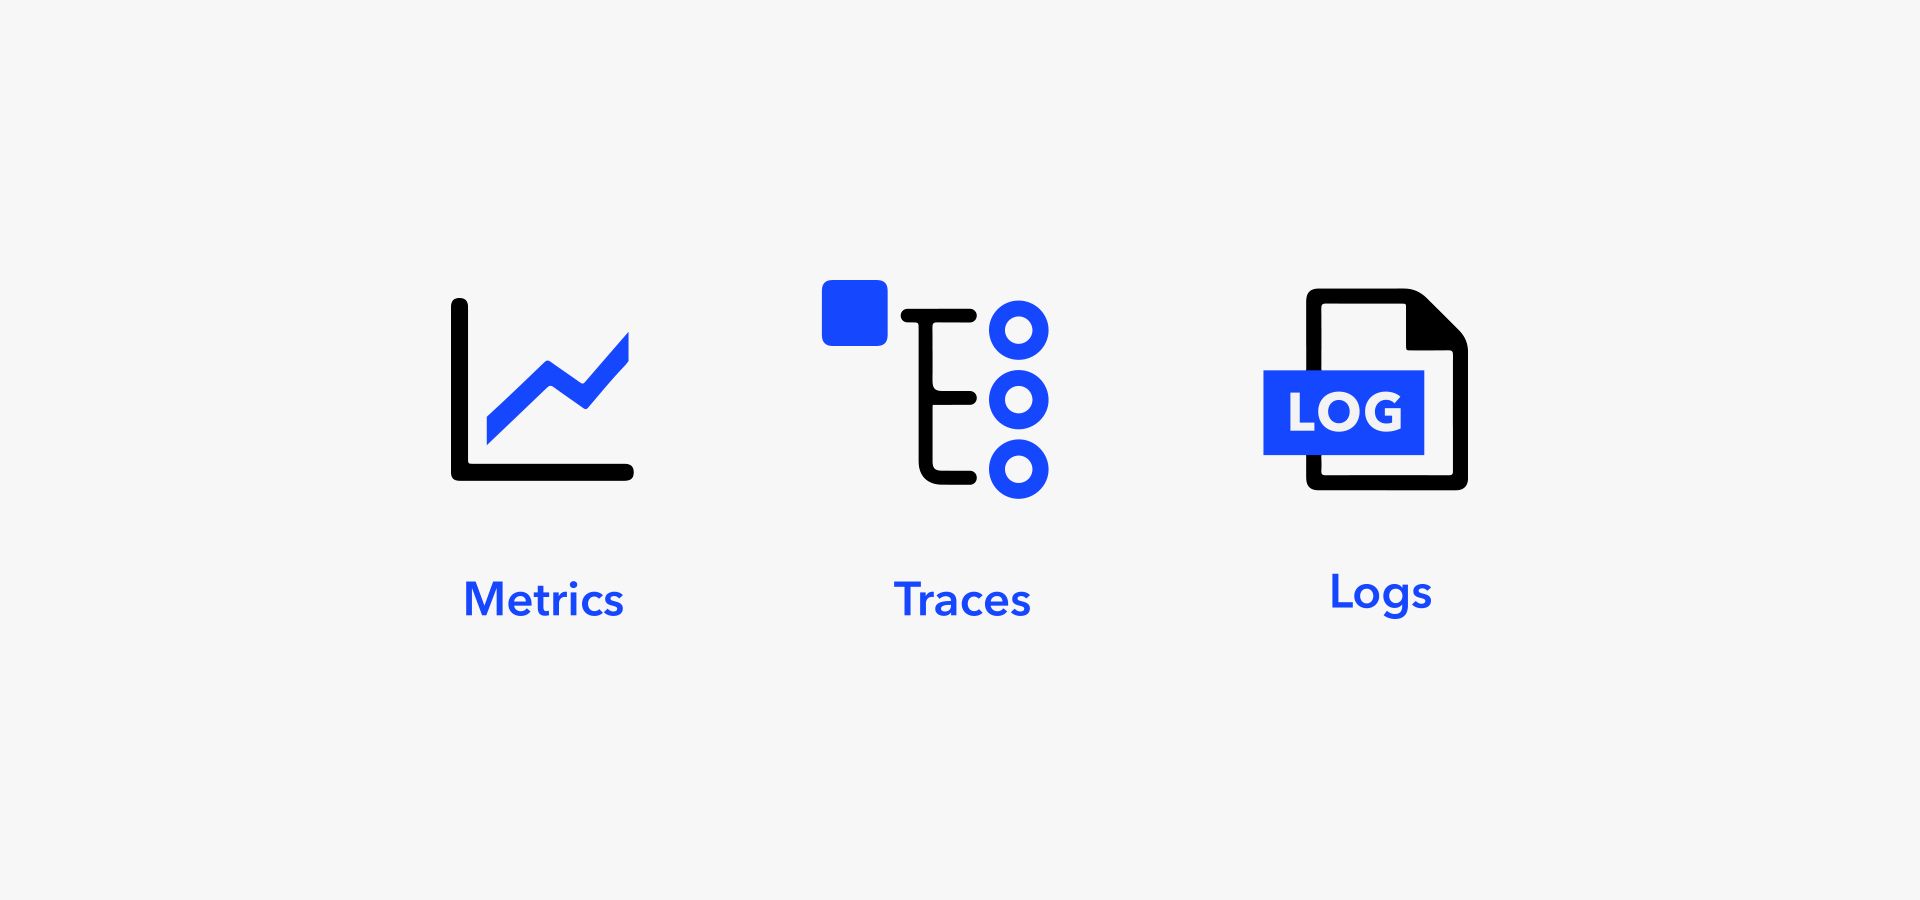
The "Pillars of Observability" are a set of characteristics or principles that define what observability means and how it can be achieved. There are three main pillars of observability, which are:
- Logs: Logs are a record of events that have occurred within a system, including messages, errors, and warnings. Logs are often generated by software applications and infrastructure components and can be used to gain insight into how the system is behaving and performing over time. Logs are an essential component of observability, as they provide a historical record of system events that can be analyzed and used to identify patterns and trends.
- Metrics: Metrics are quantitative measurements of a specific aspect of a system's performance, such as CPU usage, memory consumption, or network throughput. Metrics are often collected and aggregated over time to provide a high-level view of system performance and can be used to identify potential issues or areas for improvement. Metrics are an important component of observability, as they provide a quantitative way to measure and track system performance over time.
- Traces: Traces are a record of a specific transaction or request as it moves through a distributed system, including all of the different components and dependencies that it touches along the way. Traces are often generated by distributed tracing systems and can be used to understand how different components of a system are interacting and affecting overall performance. Traces are a critical component of observability, especially in modern distributed systems architectures, where understanding the behavior and performance of different components is essential for maintaining system reliability and availability.
In summary, the three pillars of observability — logs, metrics, and traces — are essential components for gaining a holistic understanding of how a system is behaving and performing, and for identifying potential issues and areas for improvement. By collecting and analyzing data across these three pillars, teams can gain the insights they need to improve system performance, maintain system reliability, and prevent downtime or other issues.
Observability with Prometheus and Grafana
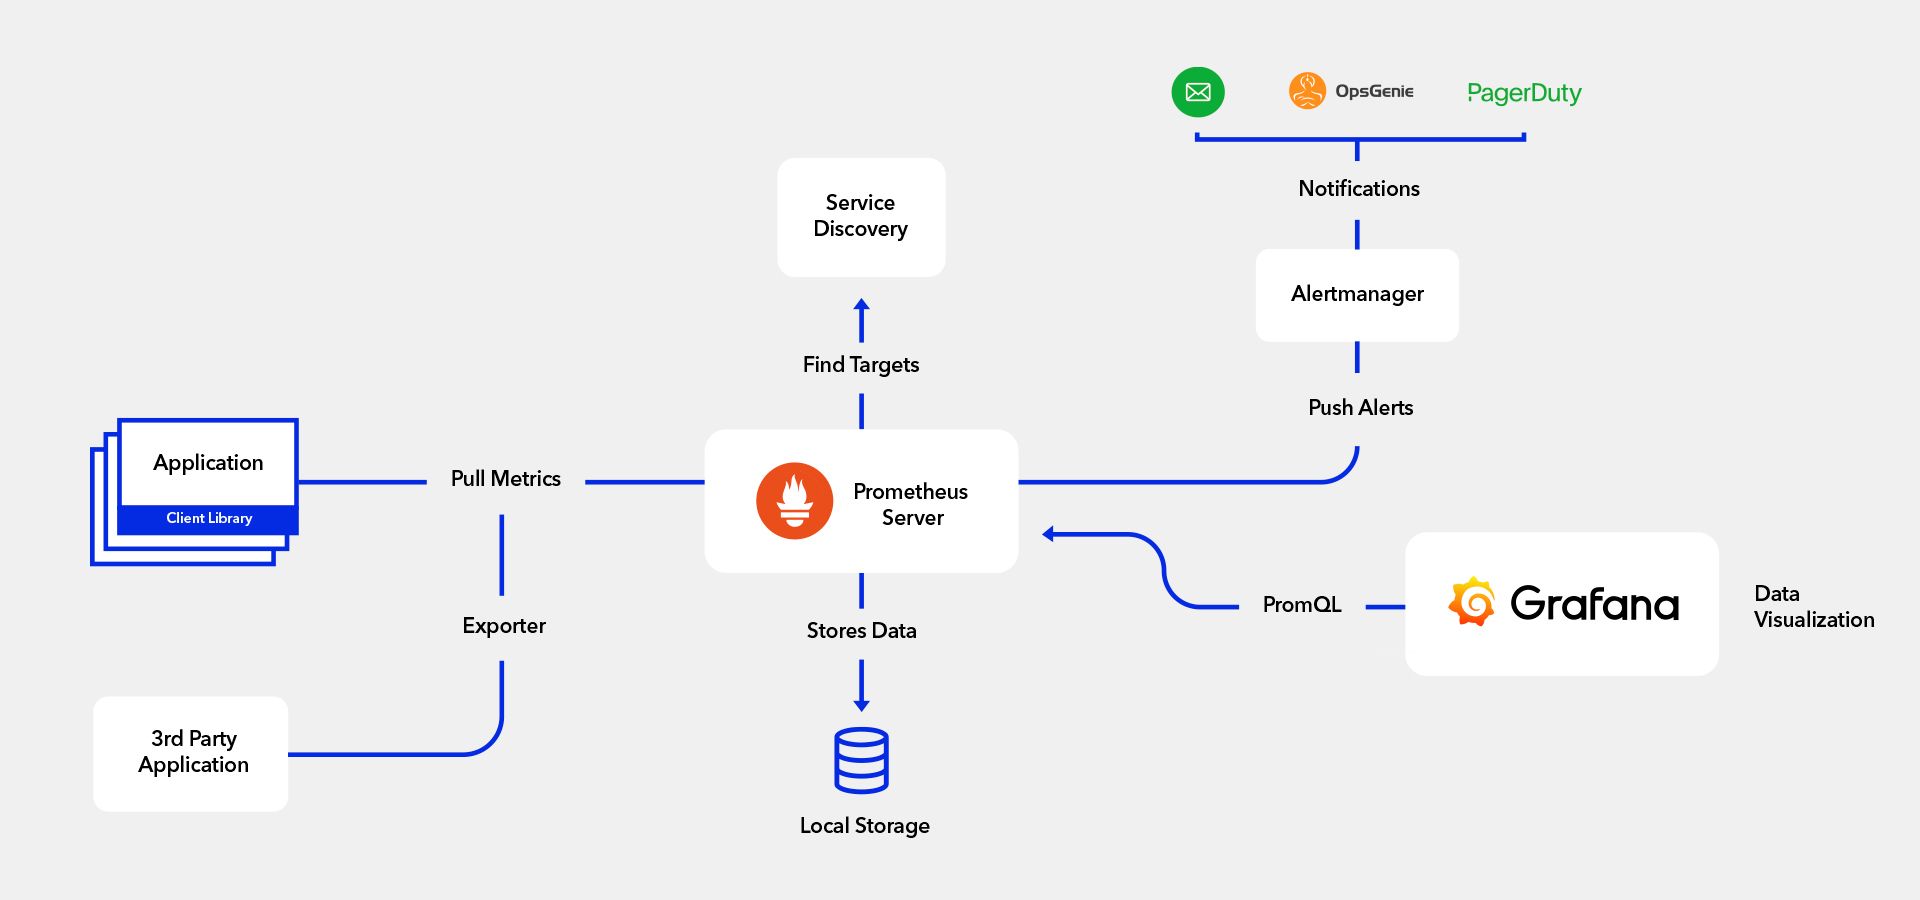
Prometheus and Grafana are two popular tools used for observability in modern software systems.
Prometheus is an open-source monitoring system that collects and stores time-series data from various sources such as application metrics, system metrics, and logs. It provides a powerful query language called PromQL to retrieve and analyze this data and has built-in alerting capabilities to notify users of issues in their systems.
Grafana is an open-source platform for data visualization and analysis that can be integrated with Prometheus to create interactive dashboards and alerts. It allows users to create customizable graphs, tables, and other visualizations from data collected by Prometheus.
Together, Prometheus and Grafana provide a comprehensive solution for observability in modern software systems, allowing users to monitor and analyze the performance and health of their applications in real-time. By using these tools, users can gain insights into the behavior of their systems, identify potential issues before they become critical, and optimize their application performance.
Hands-On Example
For this Hands-On Example, we will run a local Kubernetes cluster using minikube and we will deploy a few example apps, we will also use Helm to help me install Prometheus and Grafana
As initial setup we’re gonna have a local Kubernetes cluster with minikube also we’re gonna have helm installed:
minikube:
$ minikube version

// Should output something like this:
minikube version: v1.28.0
commit: 986b1ebd987211ed16f8cc10aed7d2c42fc8392f
Now we start a new Kubernetes cluster using minikube start
$ minikube start

// Should output something like this:
...
Done! kubectl is now configured to use "minikube" cluster and "default" namespace as default
...
helm:
$ helm version

// output
version.BuildInfo{Version:"v3.11.2", GitCommit:"912ebc1cd10d38d340f048efaf0abda047c3468e", GitTreeState:"clean", GoVersion:"go1.20.2"}
Also for testing purposes we’re gonna deploy a few example apps:
example deployment:
apiVersion: apps/v1
kind: Deployment
metadata:
name: frontend1-container
namespace: test-namespace # Specify the namespace
labels:
app: frontend1-container
spec:
replicas: 2
selector:
matchLabels:
app: frontend1-container
template:
metadata:
labels:
app: frontend1-container
spec:
containers:
- name: frontend1-container
image: simondevc/frontend1-test:latest
ports:
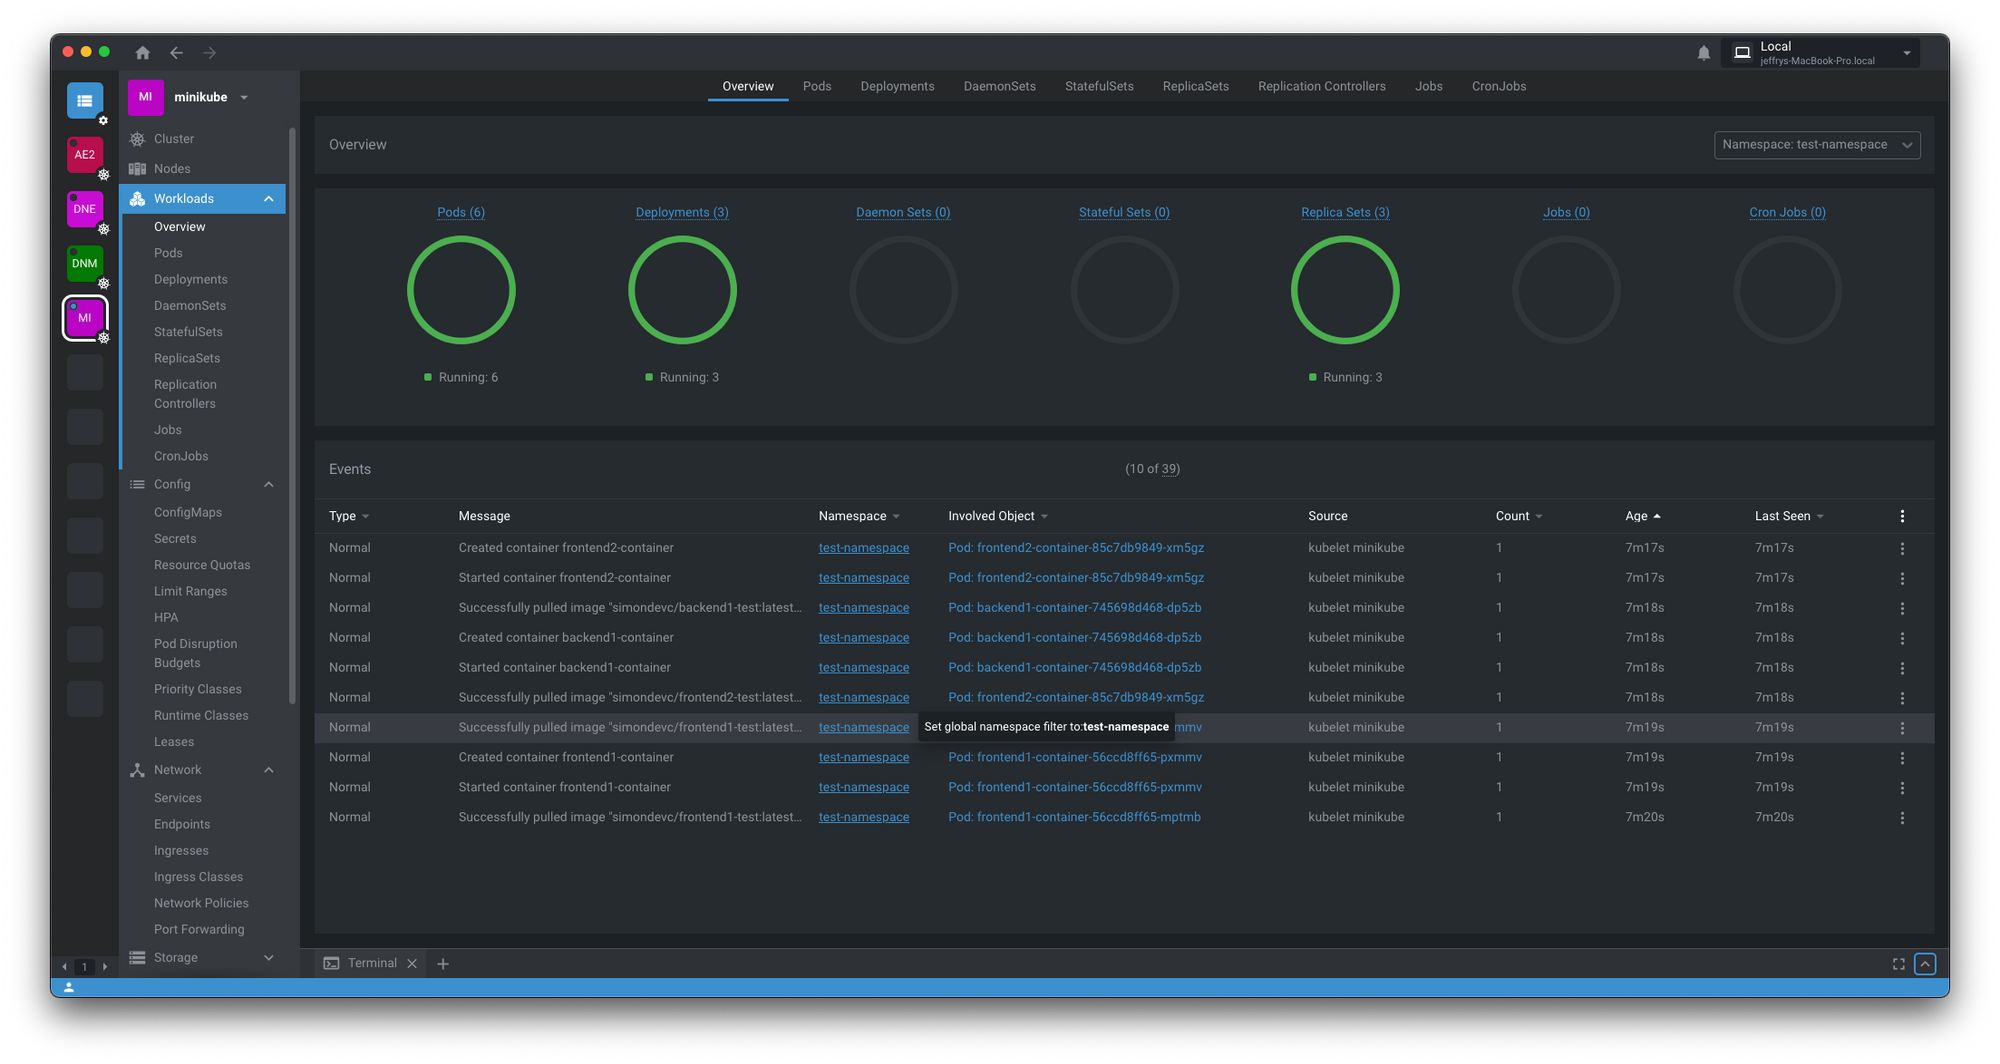
- containerPort: 3000This is how our initial cluster should look like:
For this installation, we’re gonna rely on a tool called helm and we are using helm because installing Prometheus and Grafana manually can be quite complex since it has a lot of moving parts, for example, this is the template of the official Prometheus helm chart template:
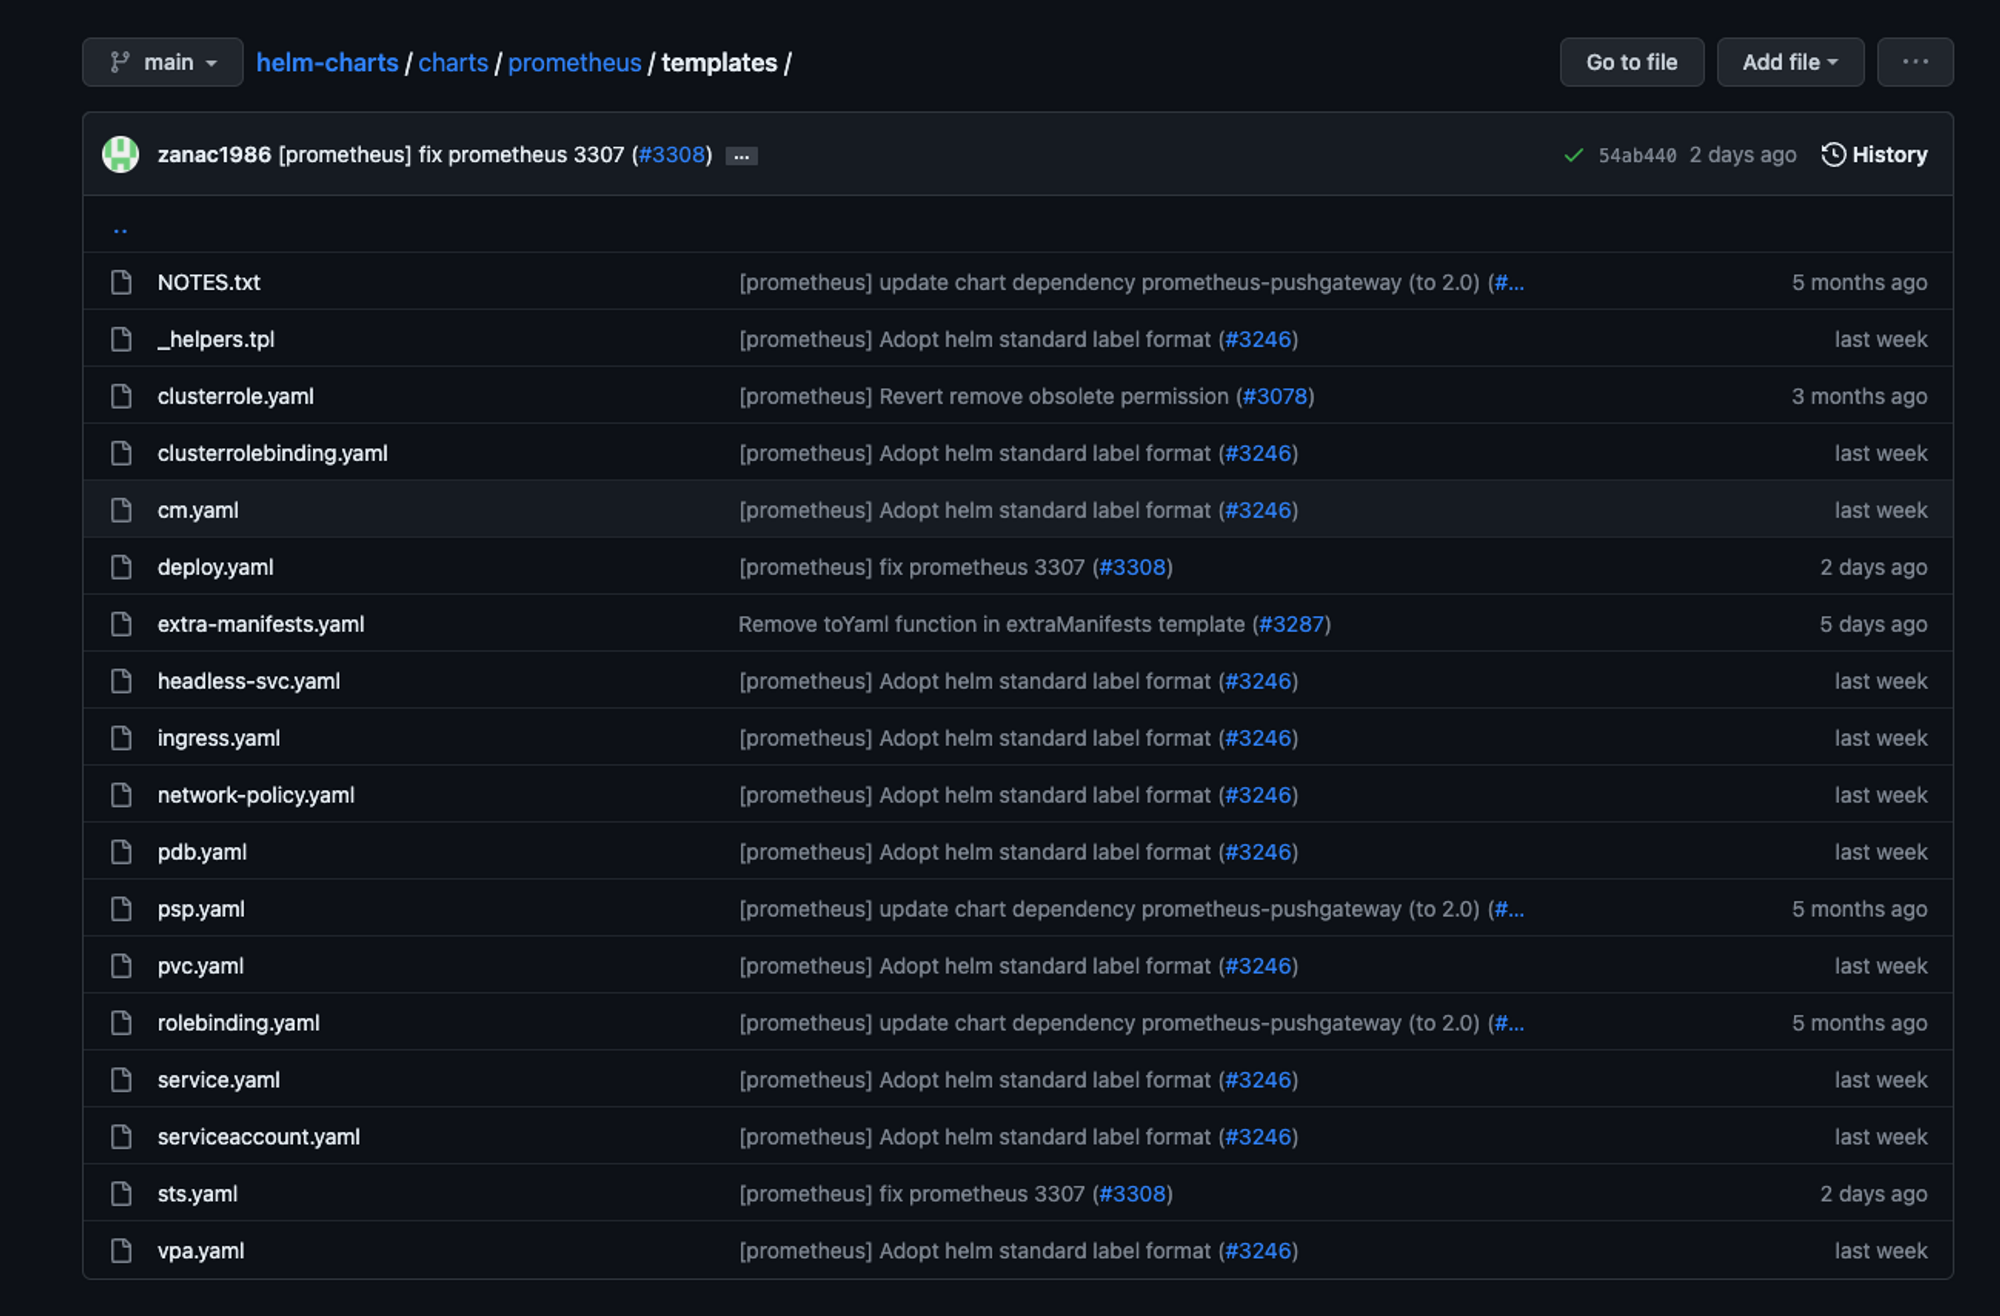
As you can see we have quite a few manifest files here that have their own configurations, and it's unnecessary since we can simply use it in helm.
Helm installation:
For this, first, we need to add the official Prometheus helm repo and update it
helm repo add prometheus-community https://prometheus-community.github.io/helm-charts

helm repo update
Once we have our repo added and updated we can proceed to install Prometheus in our local cluster:
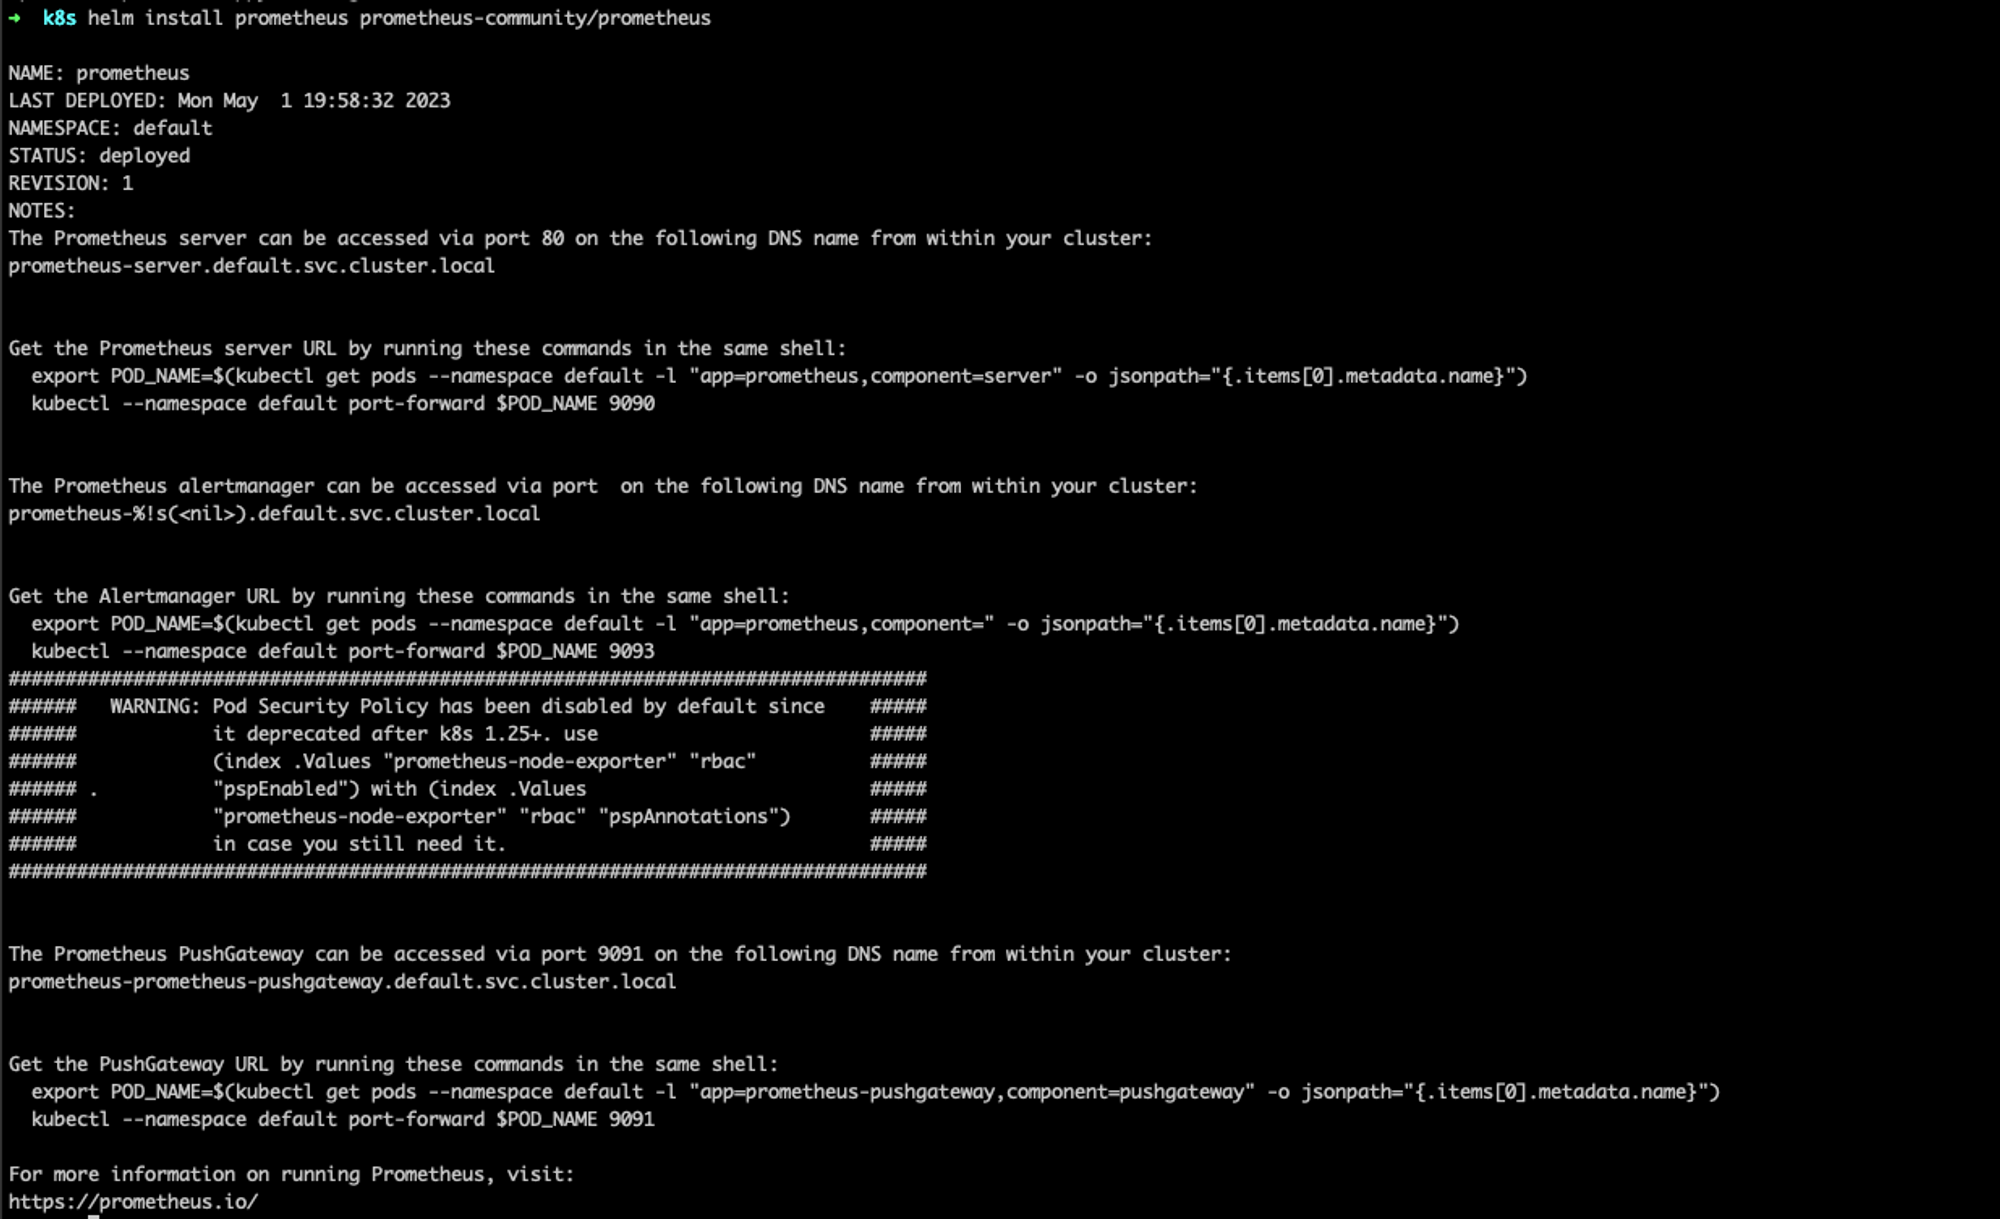
helm install prometheus prometheus-community/prometheus
once it's done we’ll see this in our terminal:
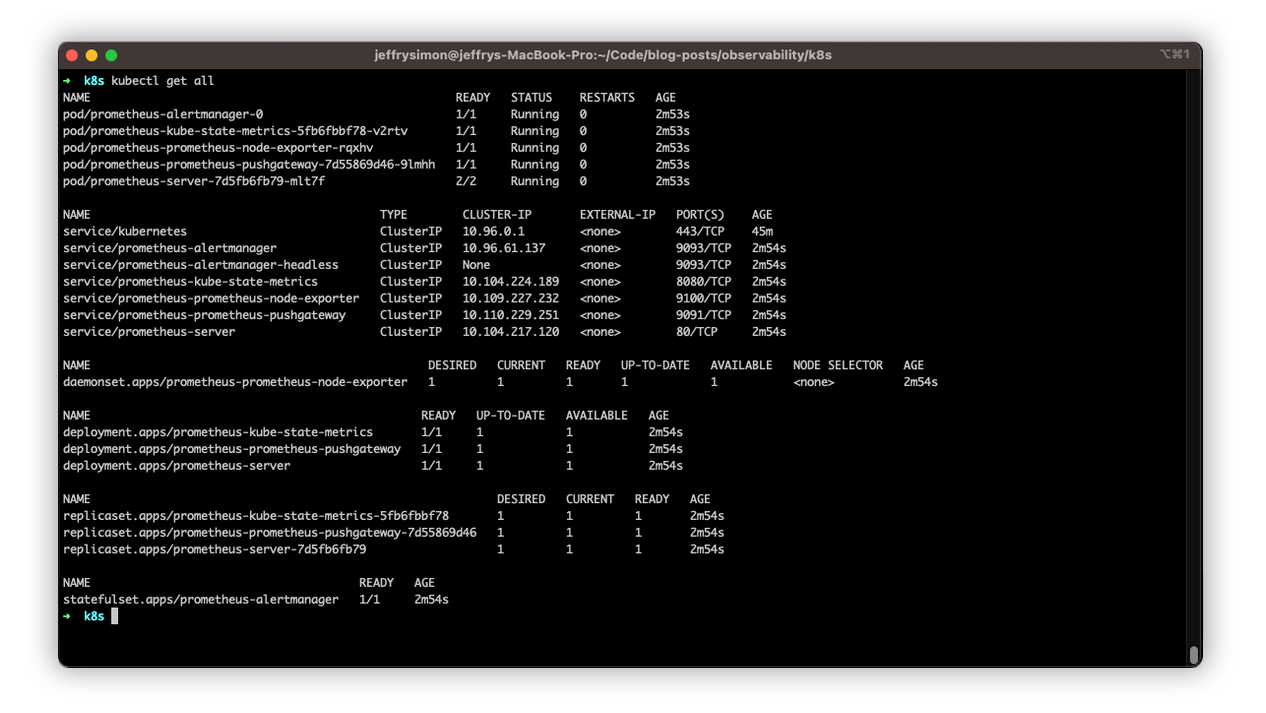
We can see all the resources created by helm that are required for Prometheus and Grafana to run:
In order to access Prometheus and Grafana we need to run the next commands:
//The command will convert the ‘prometheus-server’ Kubernetes Service from the ‘ClusterIP’ type to the ‘NodePort’ type.
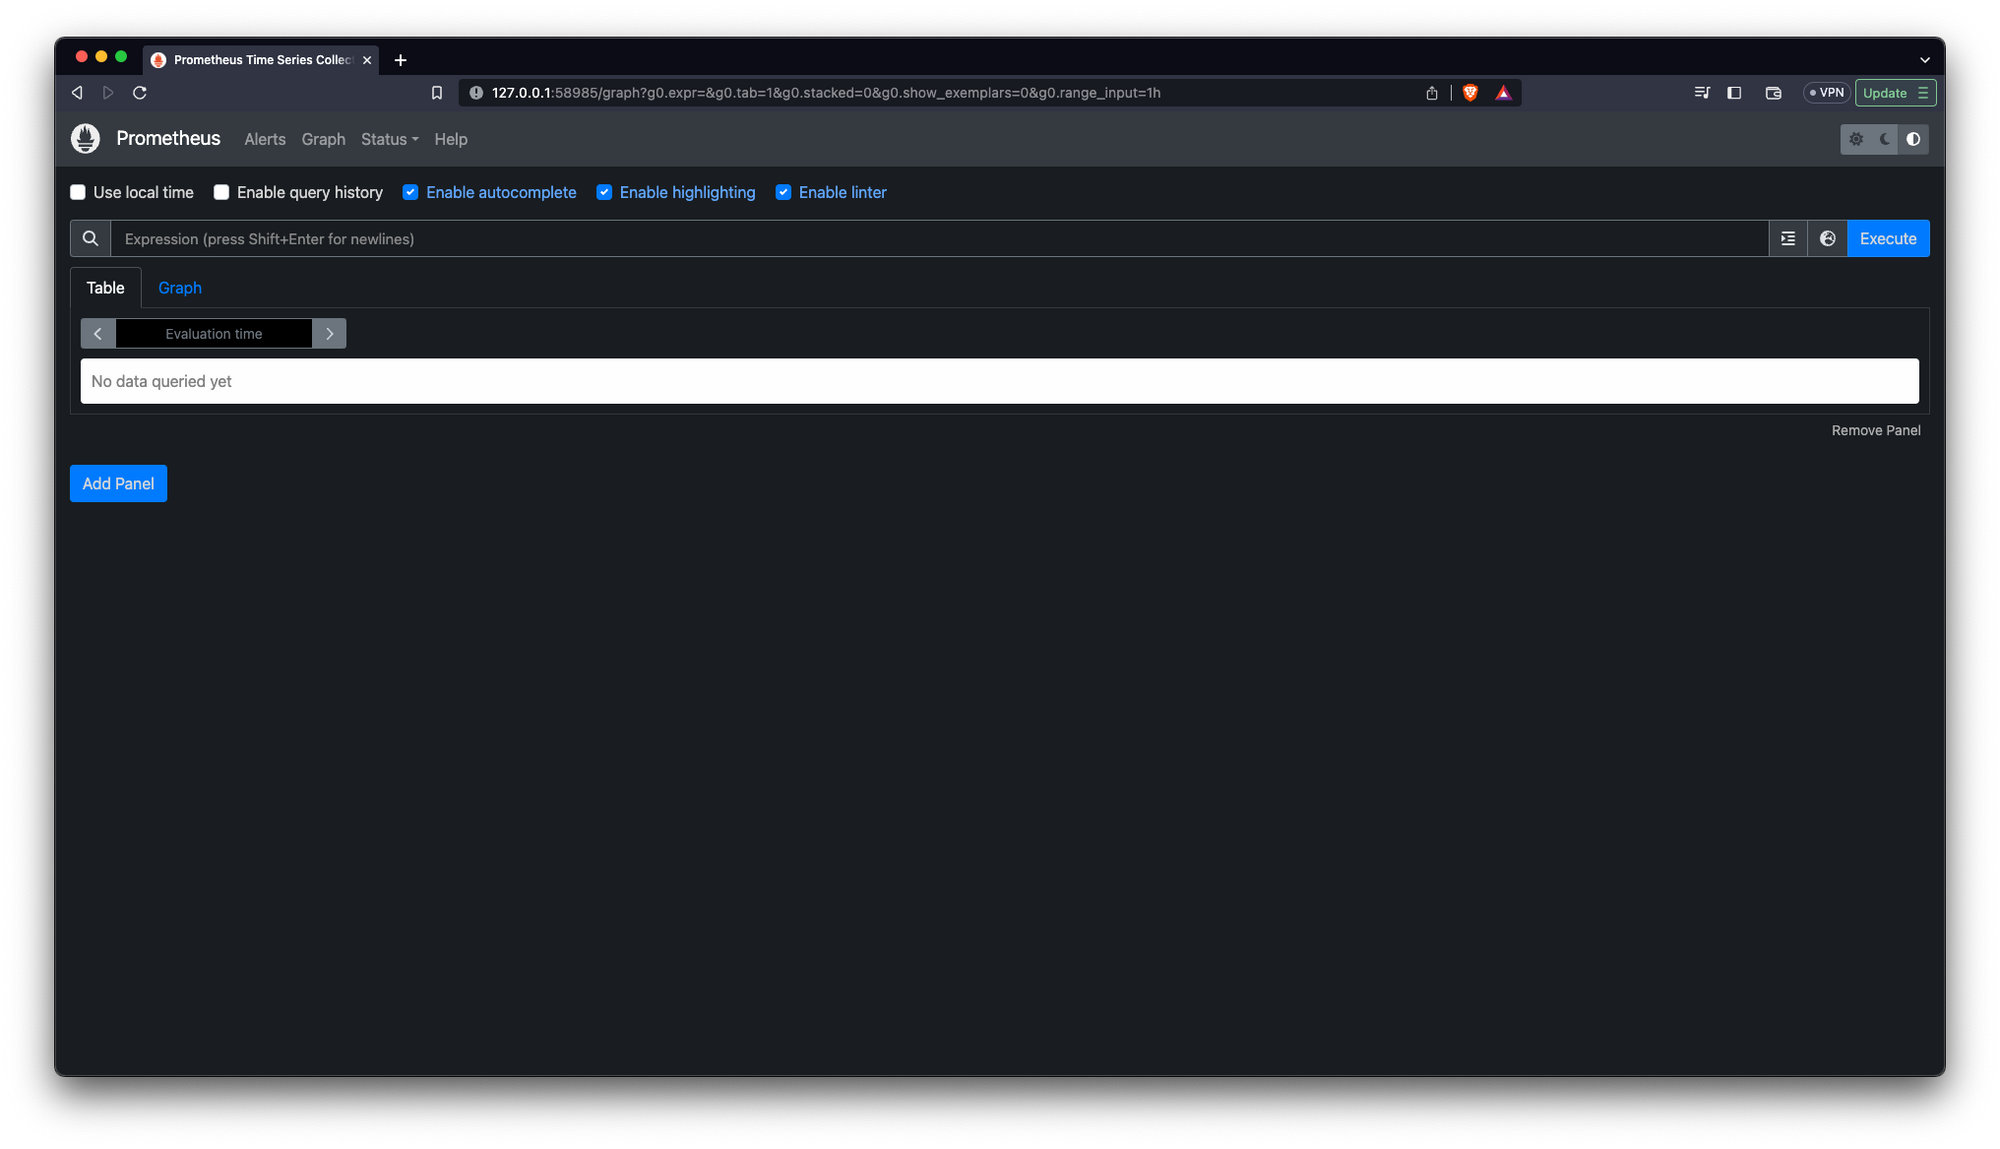
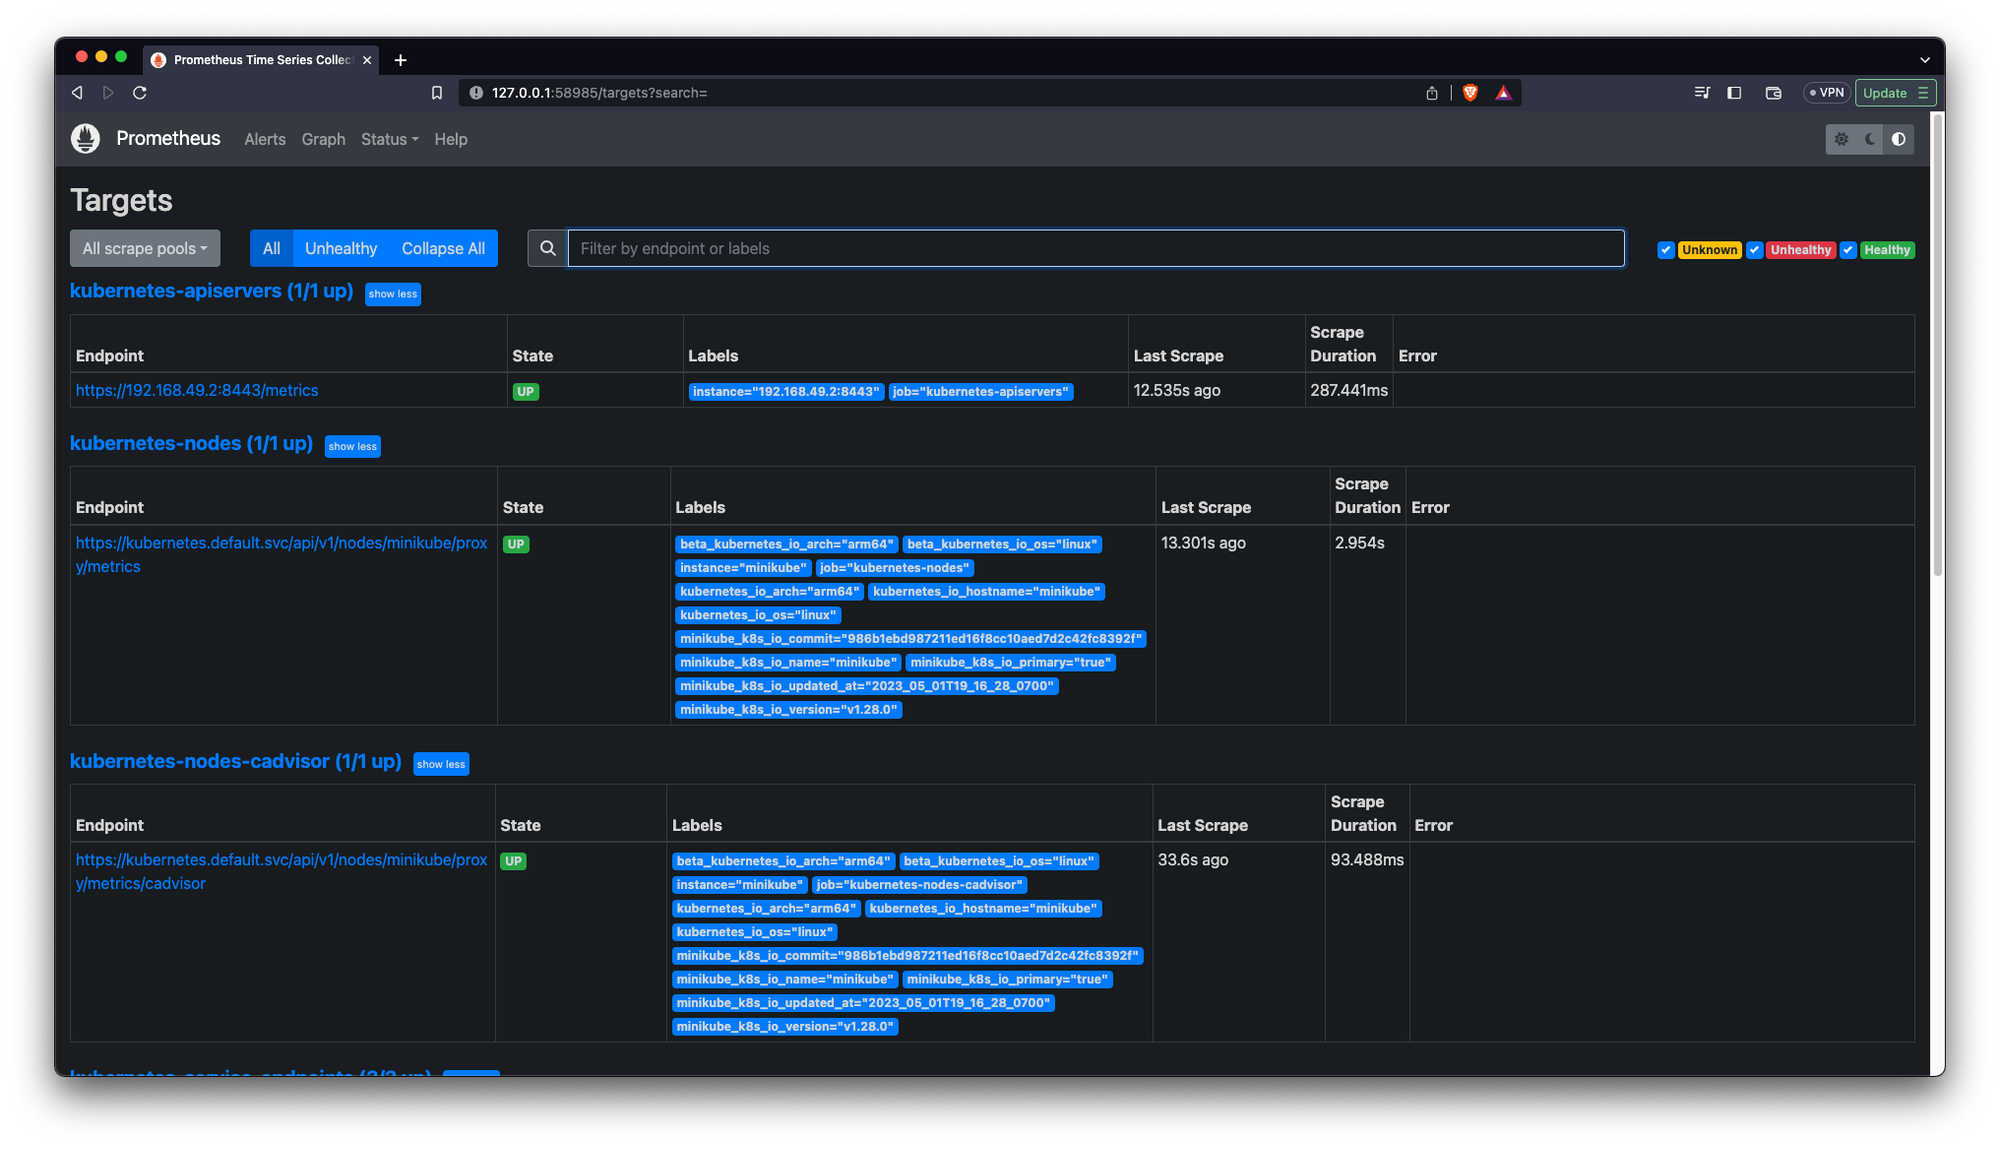
kubectl expose service prometheus-server --type=NodePort --target-port=9090 --name=prometheus-server-extAnd to lunch prometheus UI we can run:
minikube service prometheus-server-extAnd here it is:
And for Grafana we can do the same
// Install a new repo
helm repo add grafana https://grafana.github.io/helm-charts

// Update repo
helm repo update

//proceed to install grafana into the kubernetes cluster
helm install grafana grafana/grafana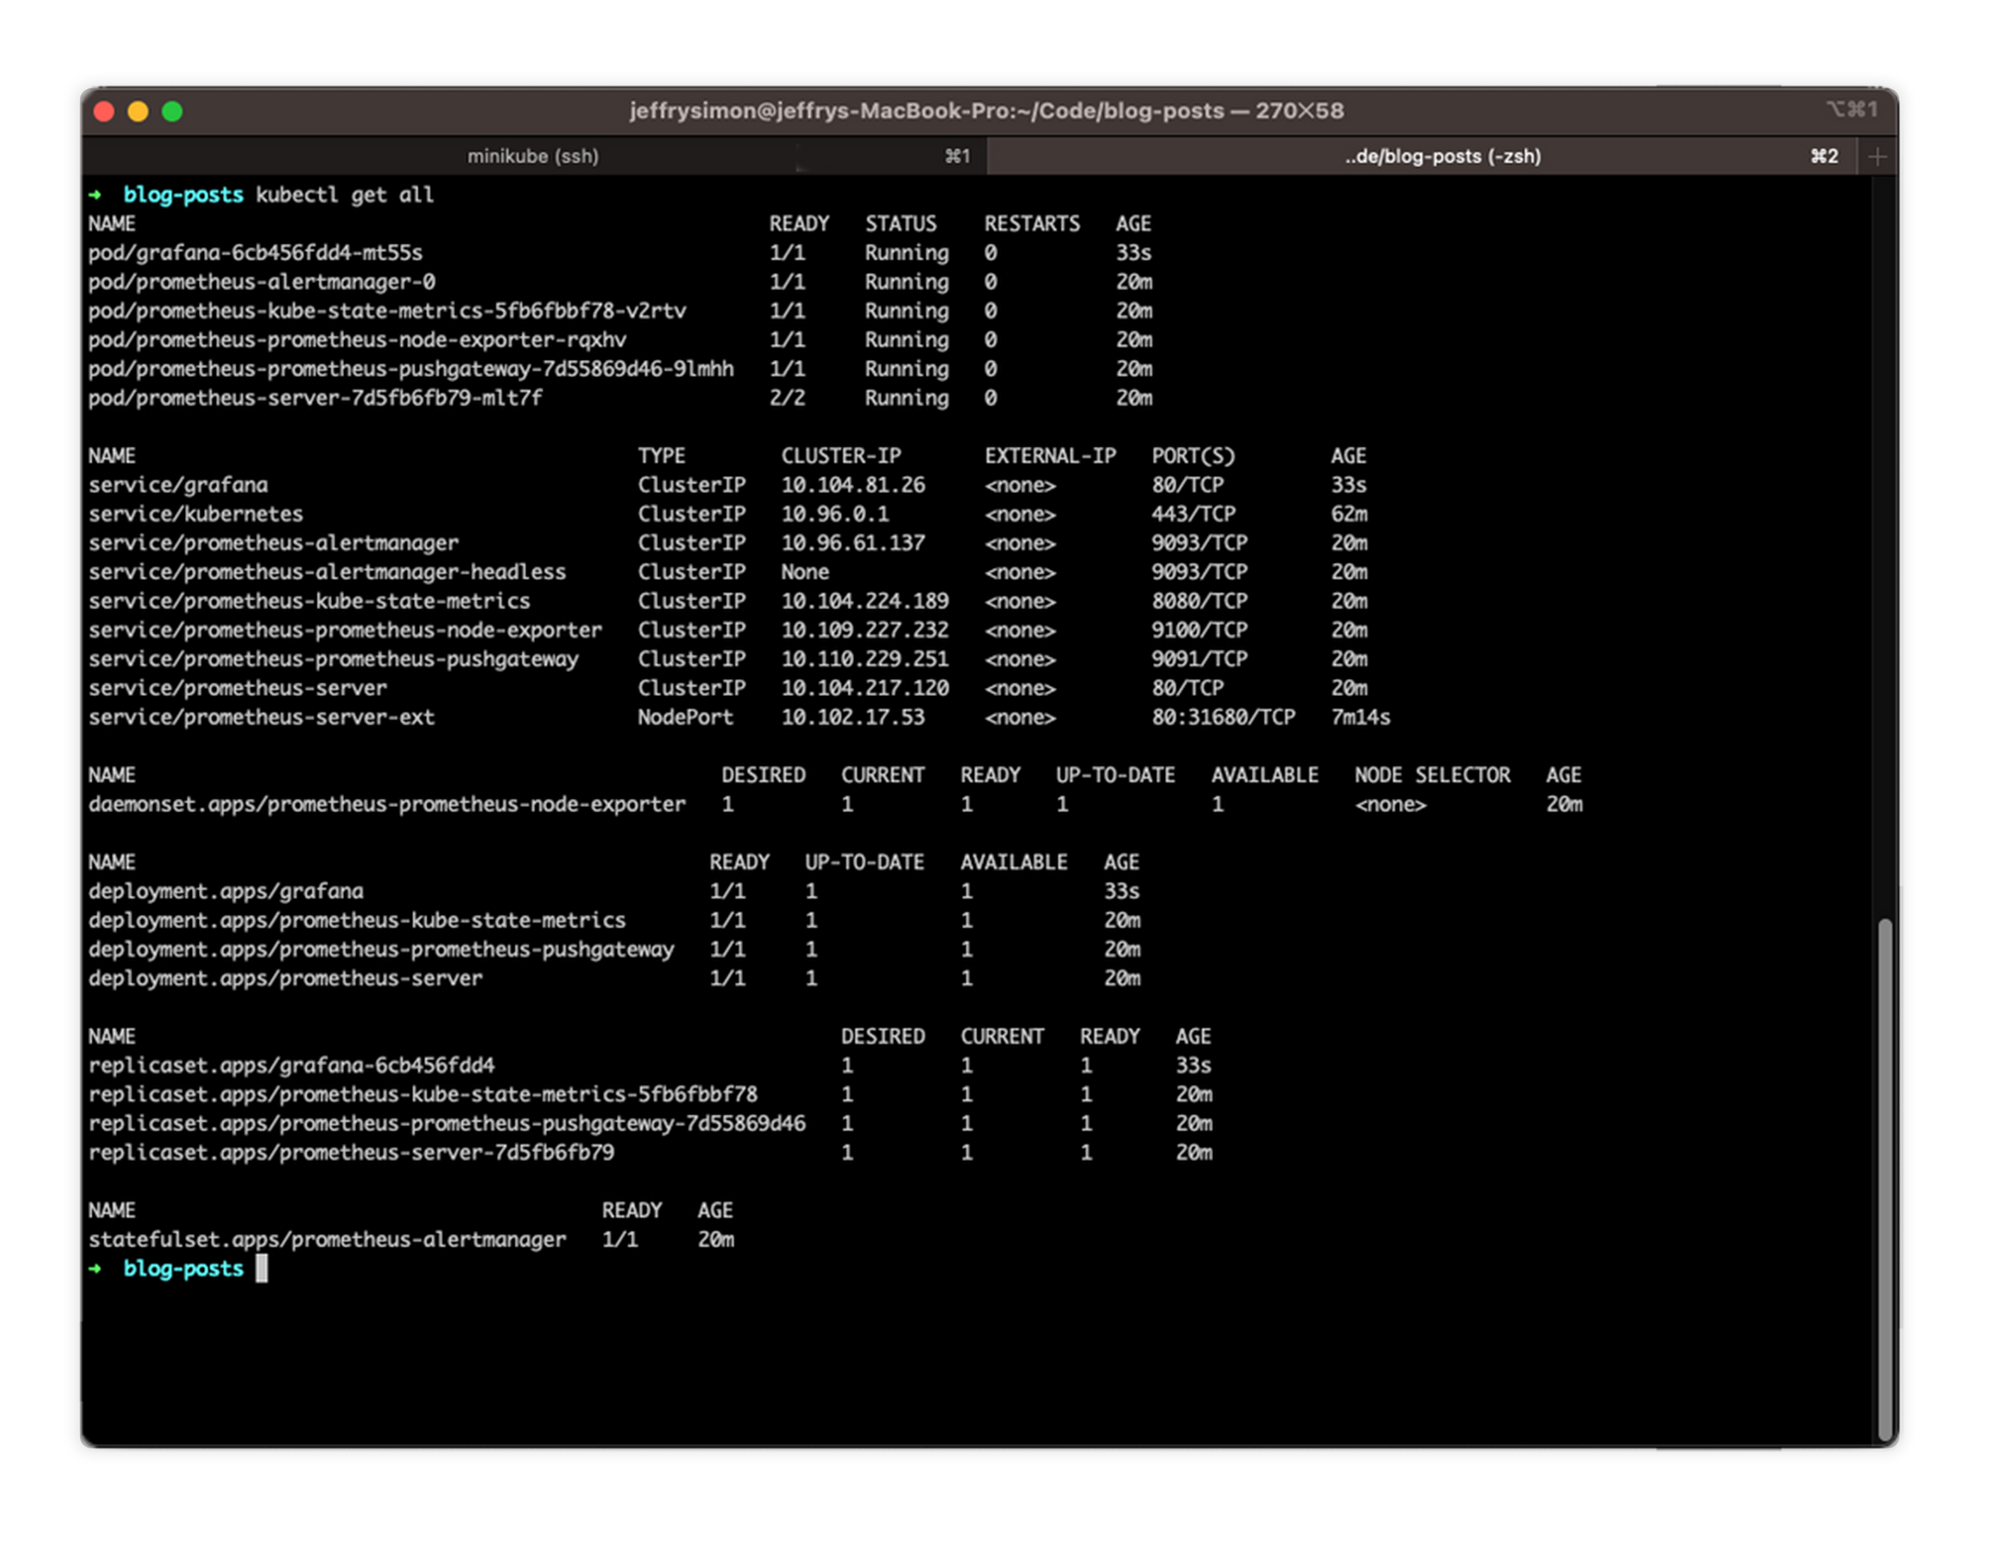
As you can see now we have new resources for our Grafana implementation, now let's access it:
// The command will also convert the ‘Grafana-server’ Kubernetes Service from the ‘ClusterIP’ type to the ‘NodePort’ type. This will allow us to access the Grafana application outside the Minikube cluster on port ‘3000’.
kubectl expose service grafana --type=NodePort --target-port=3000 --name=grafana-ext

// run service
minikube service grafana-ext
And here we go:
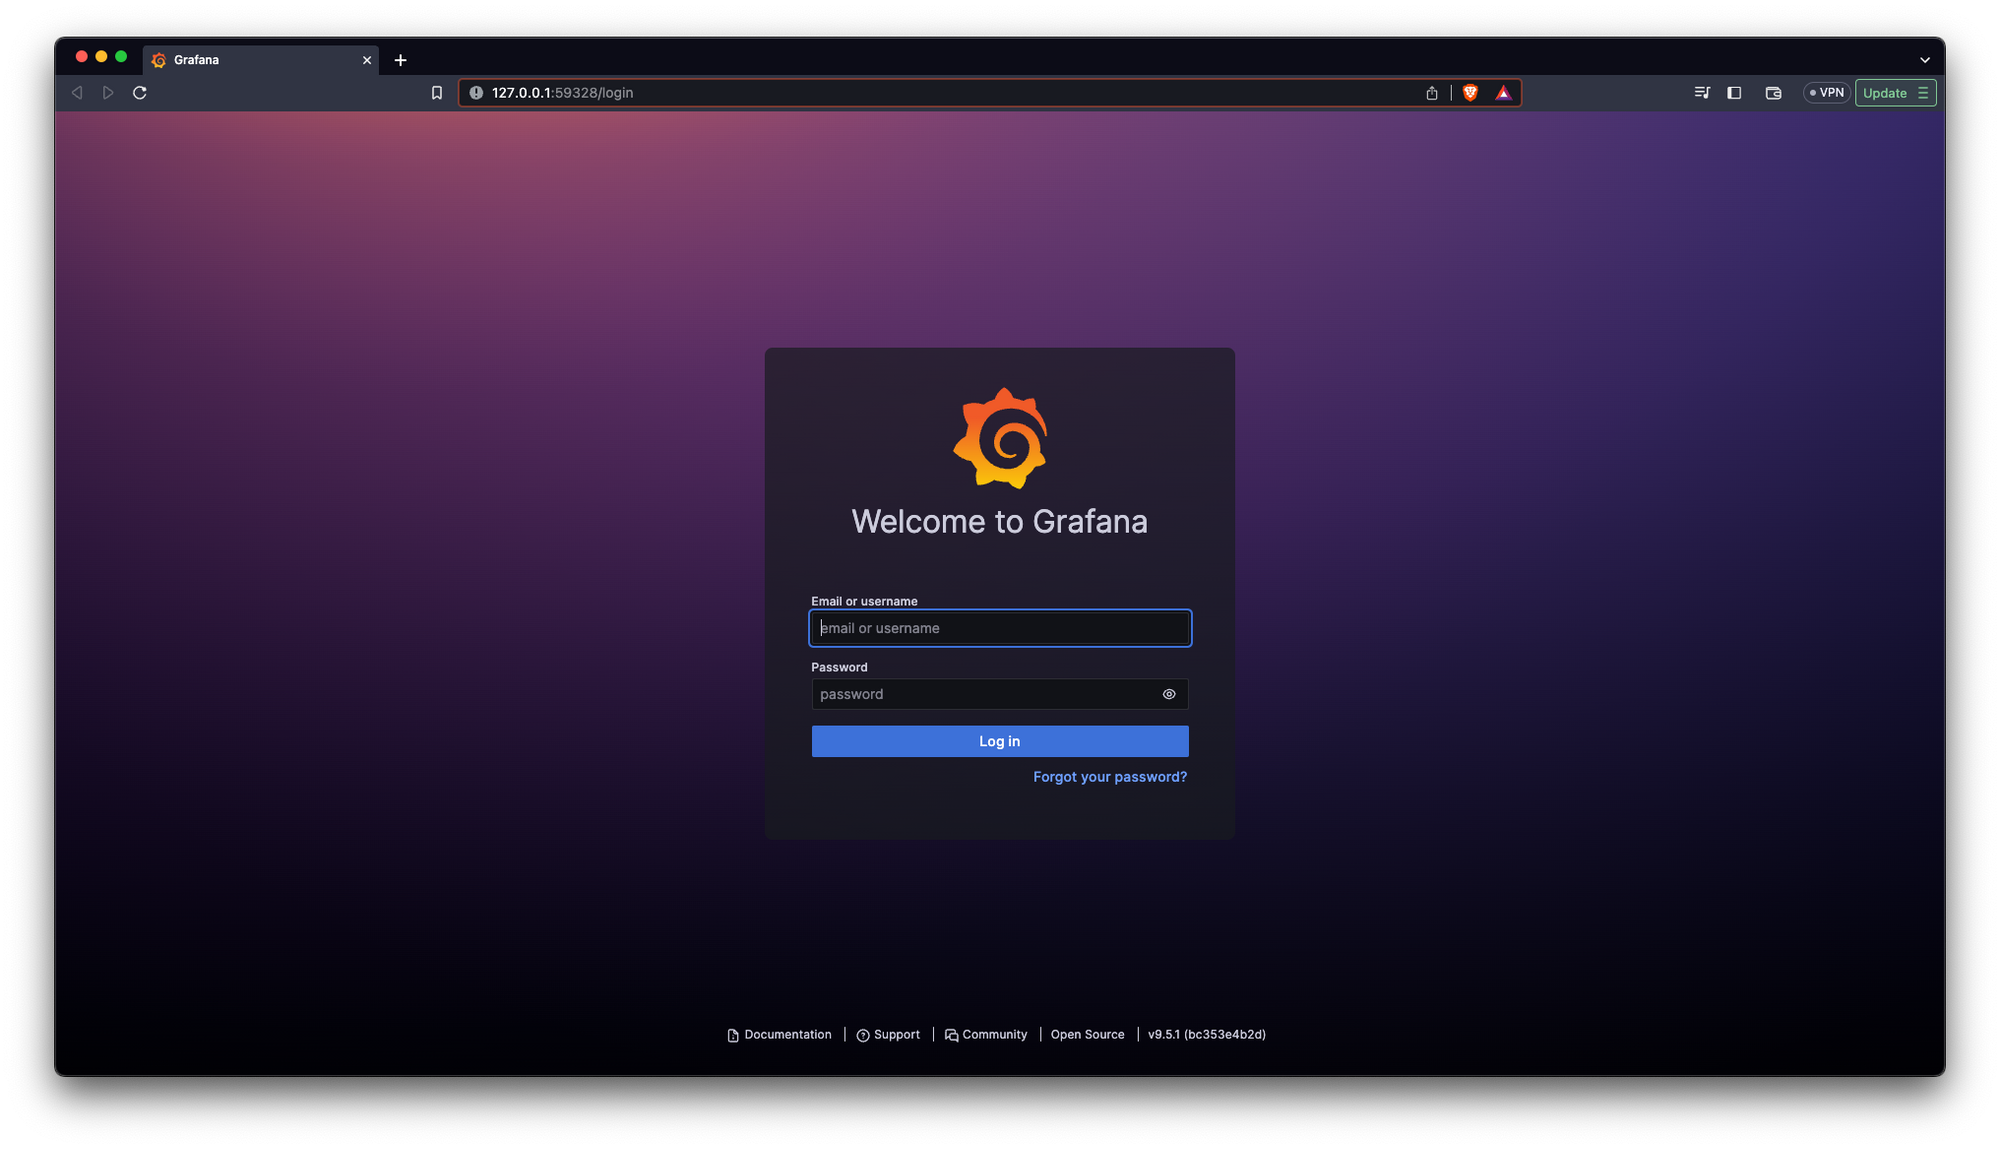
Now we need to do another thing to login into our Grafana app:
kubectl get secret --namespace default grafana -o jsonpath="{.data.admin-password}" | base64 --decode ; echoThis will print our Grafana password in the terminal:
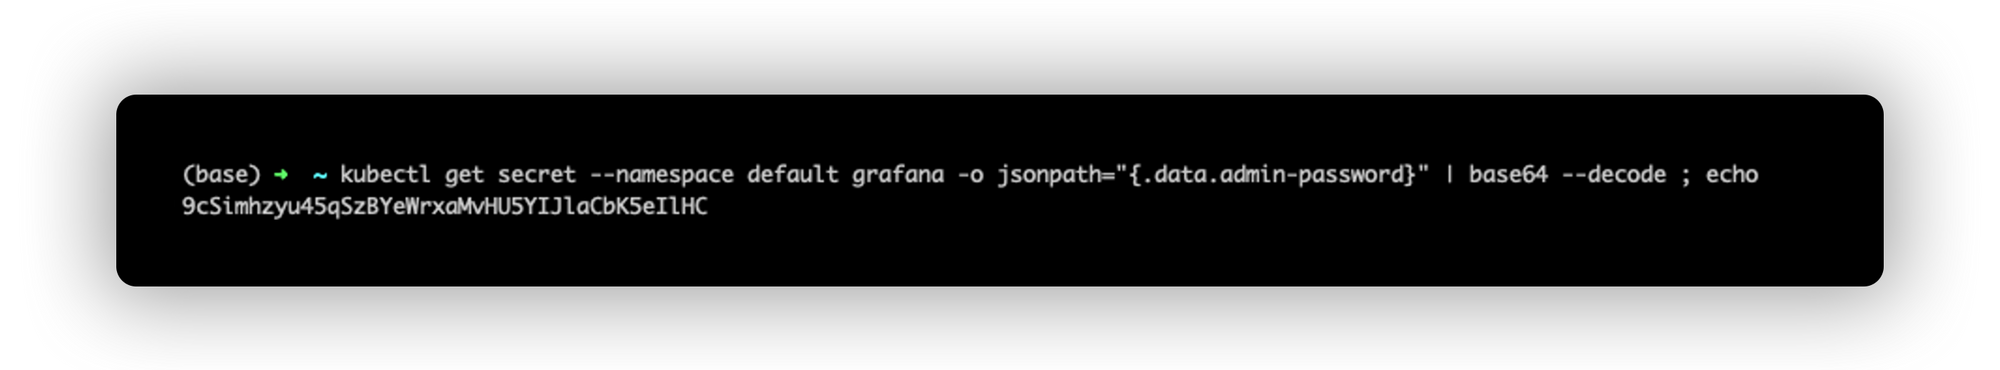
And here we go:
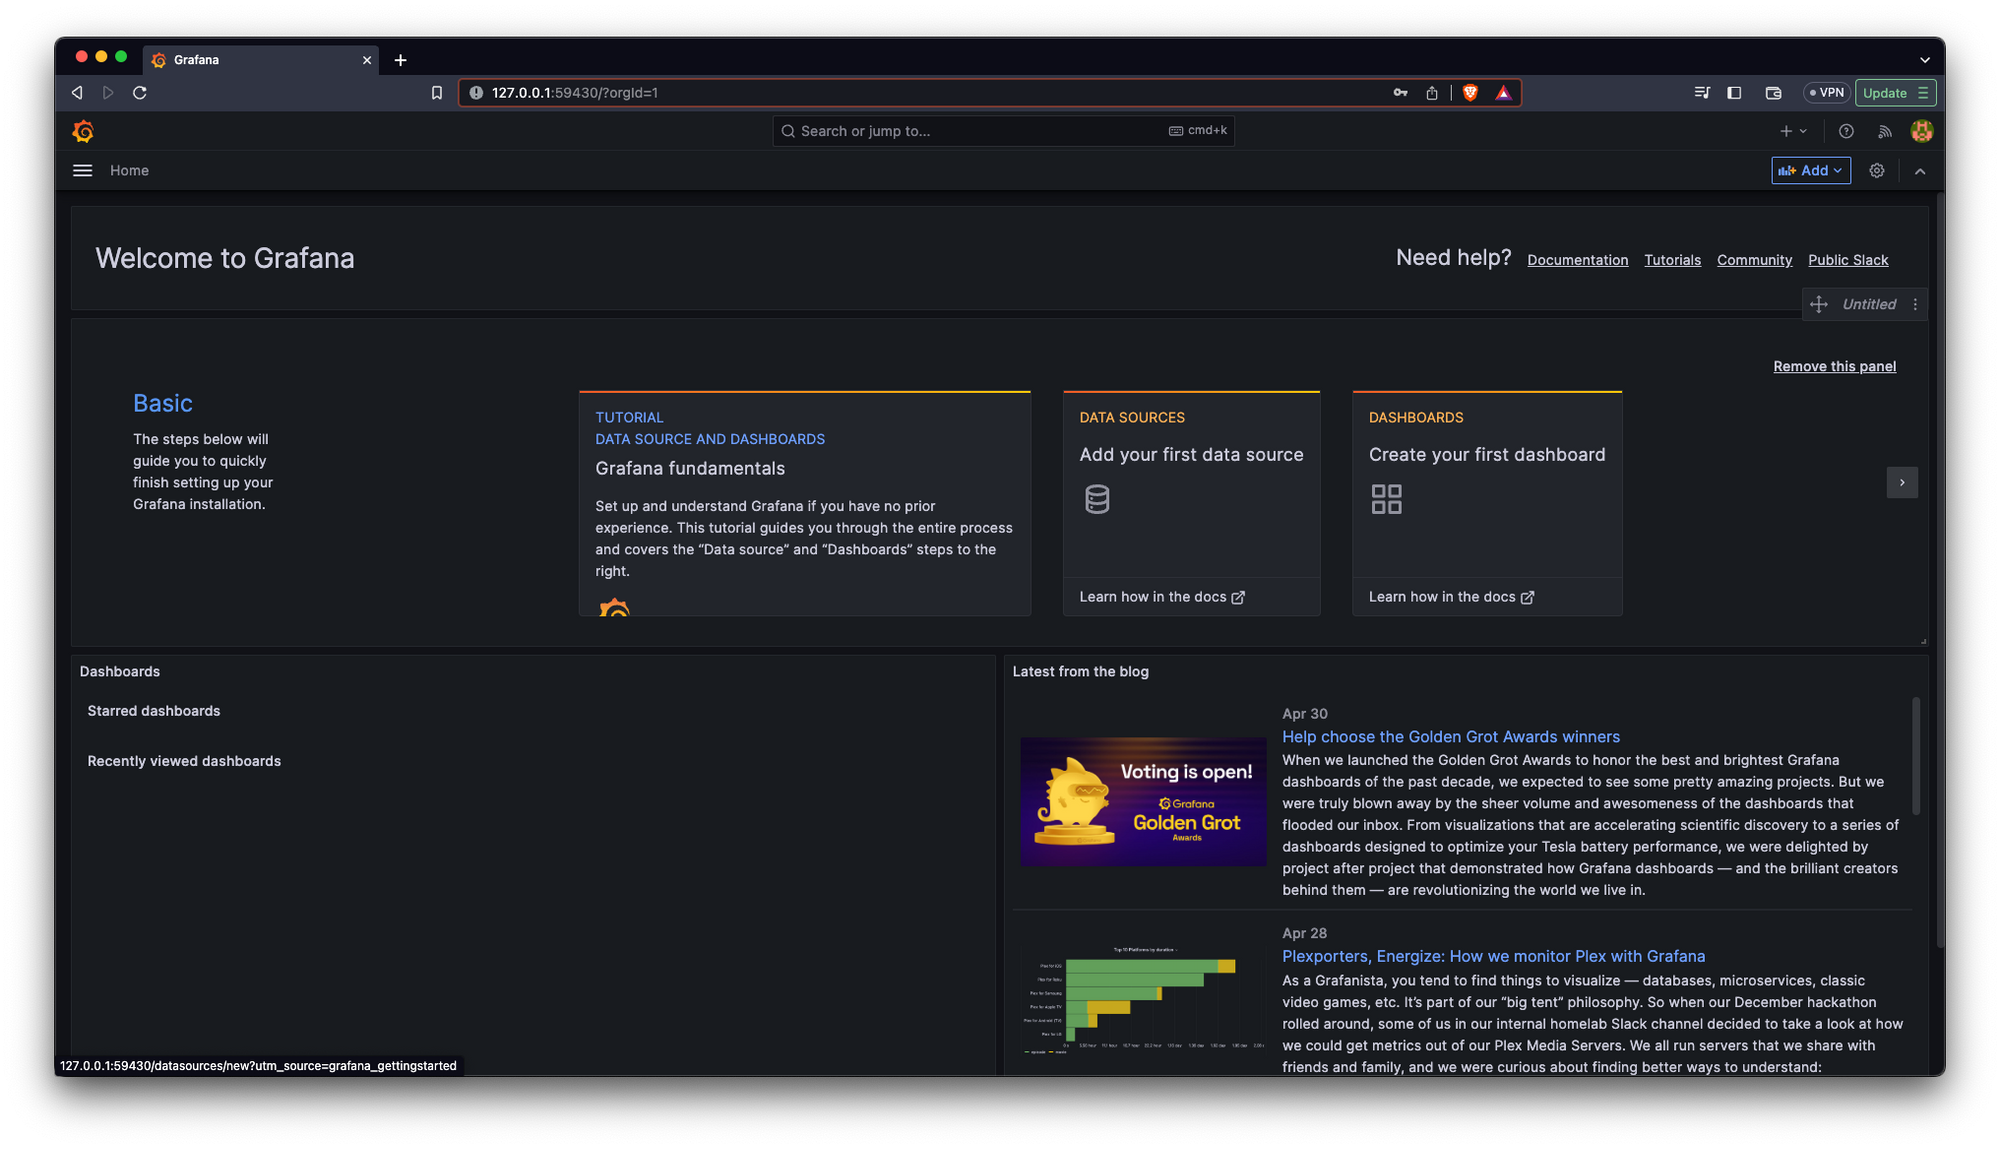
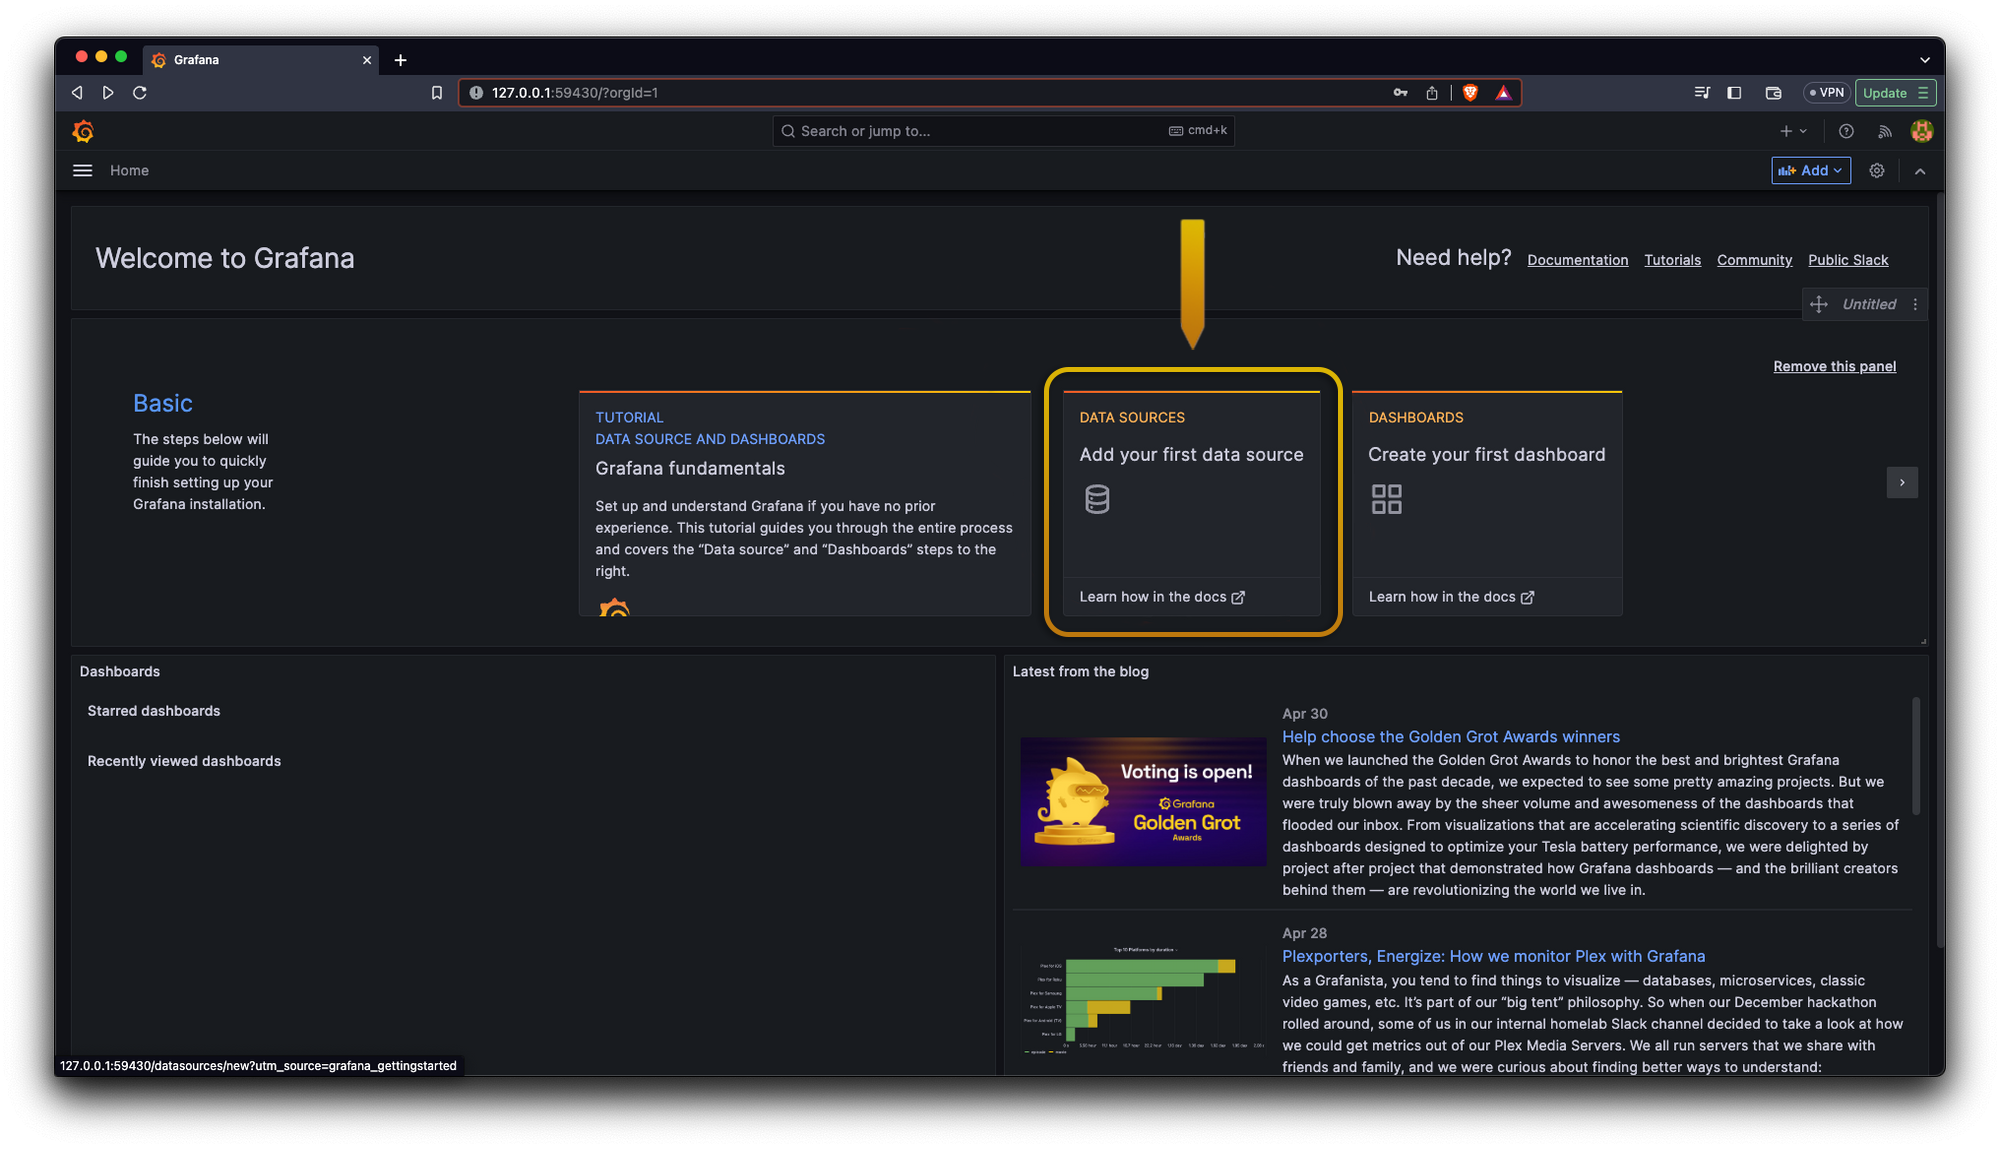
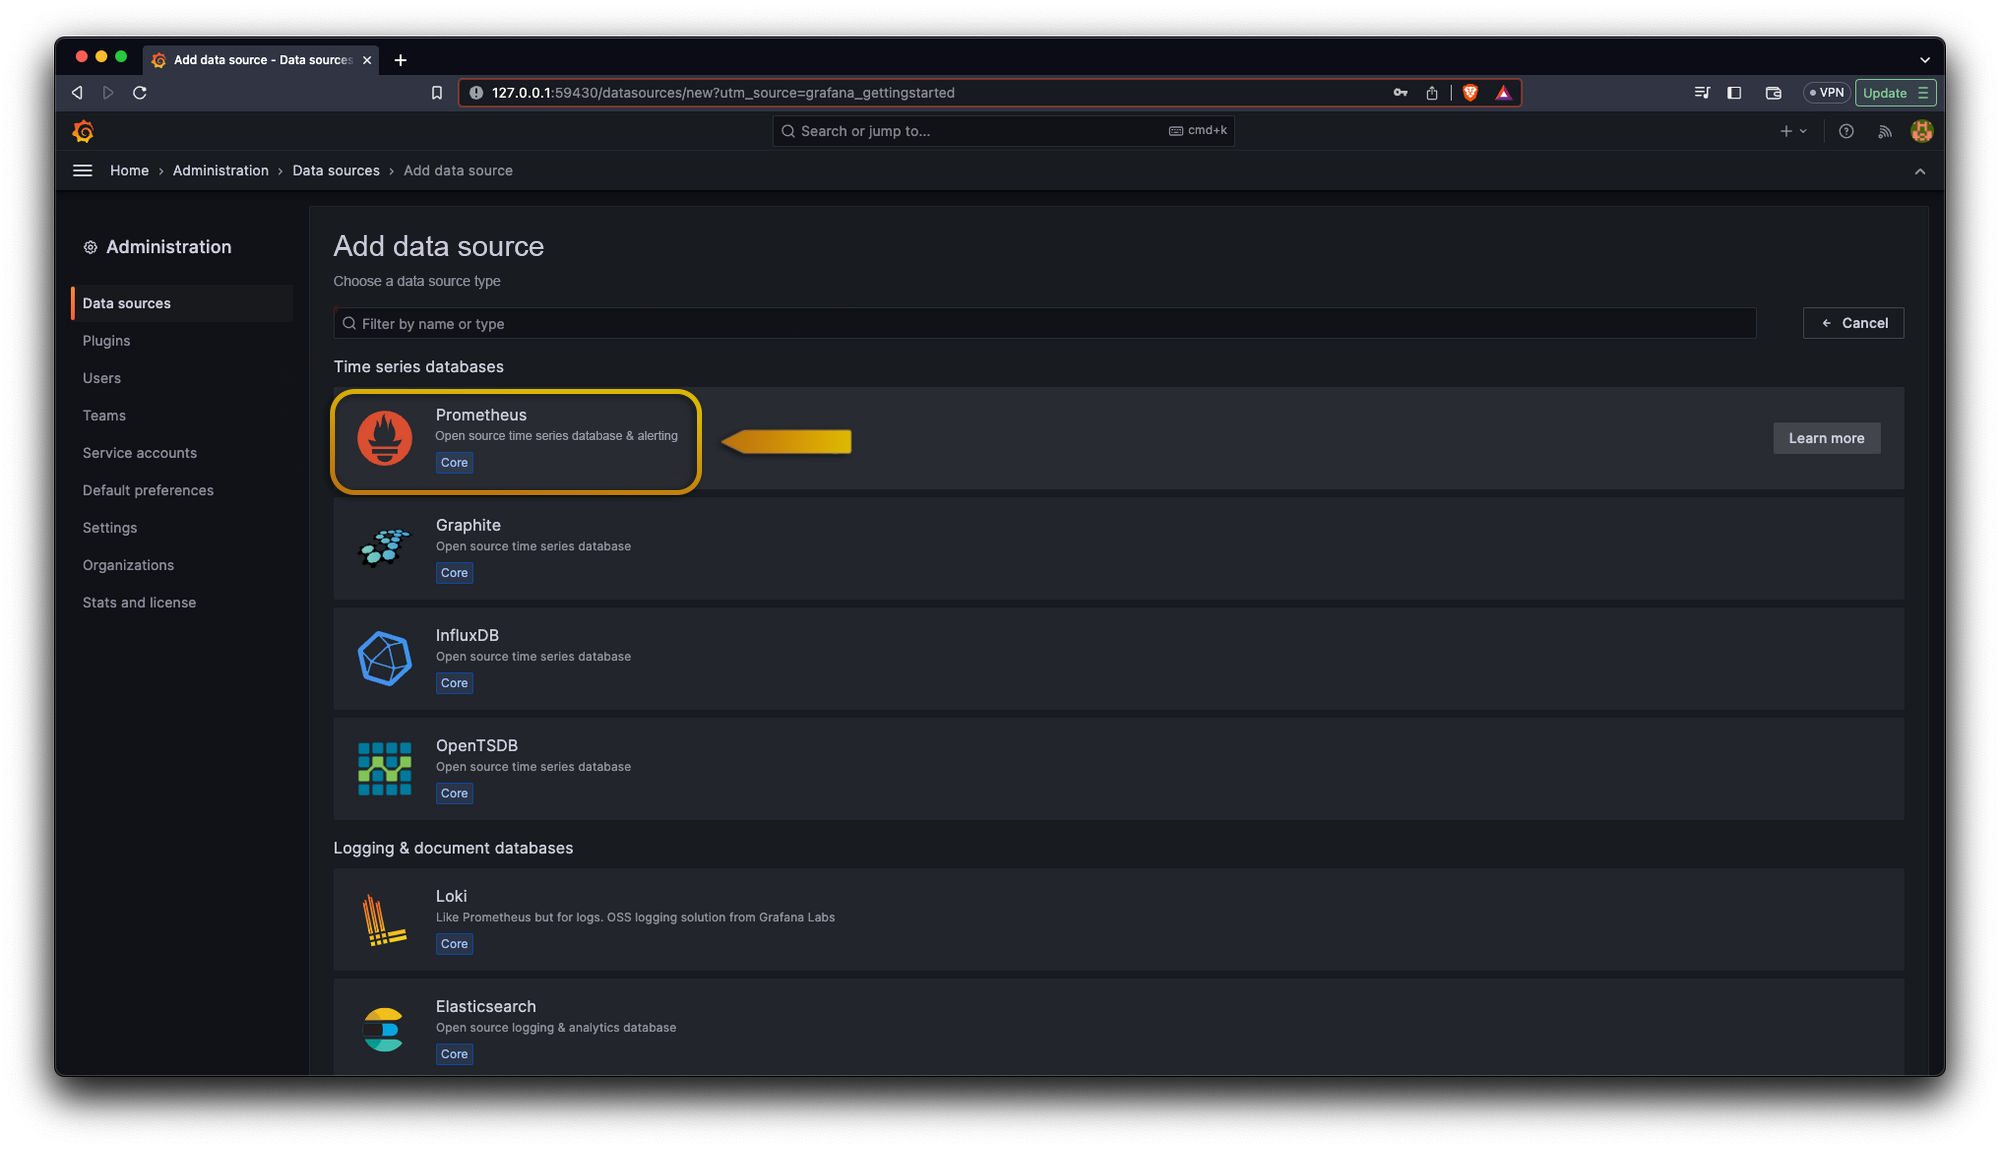
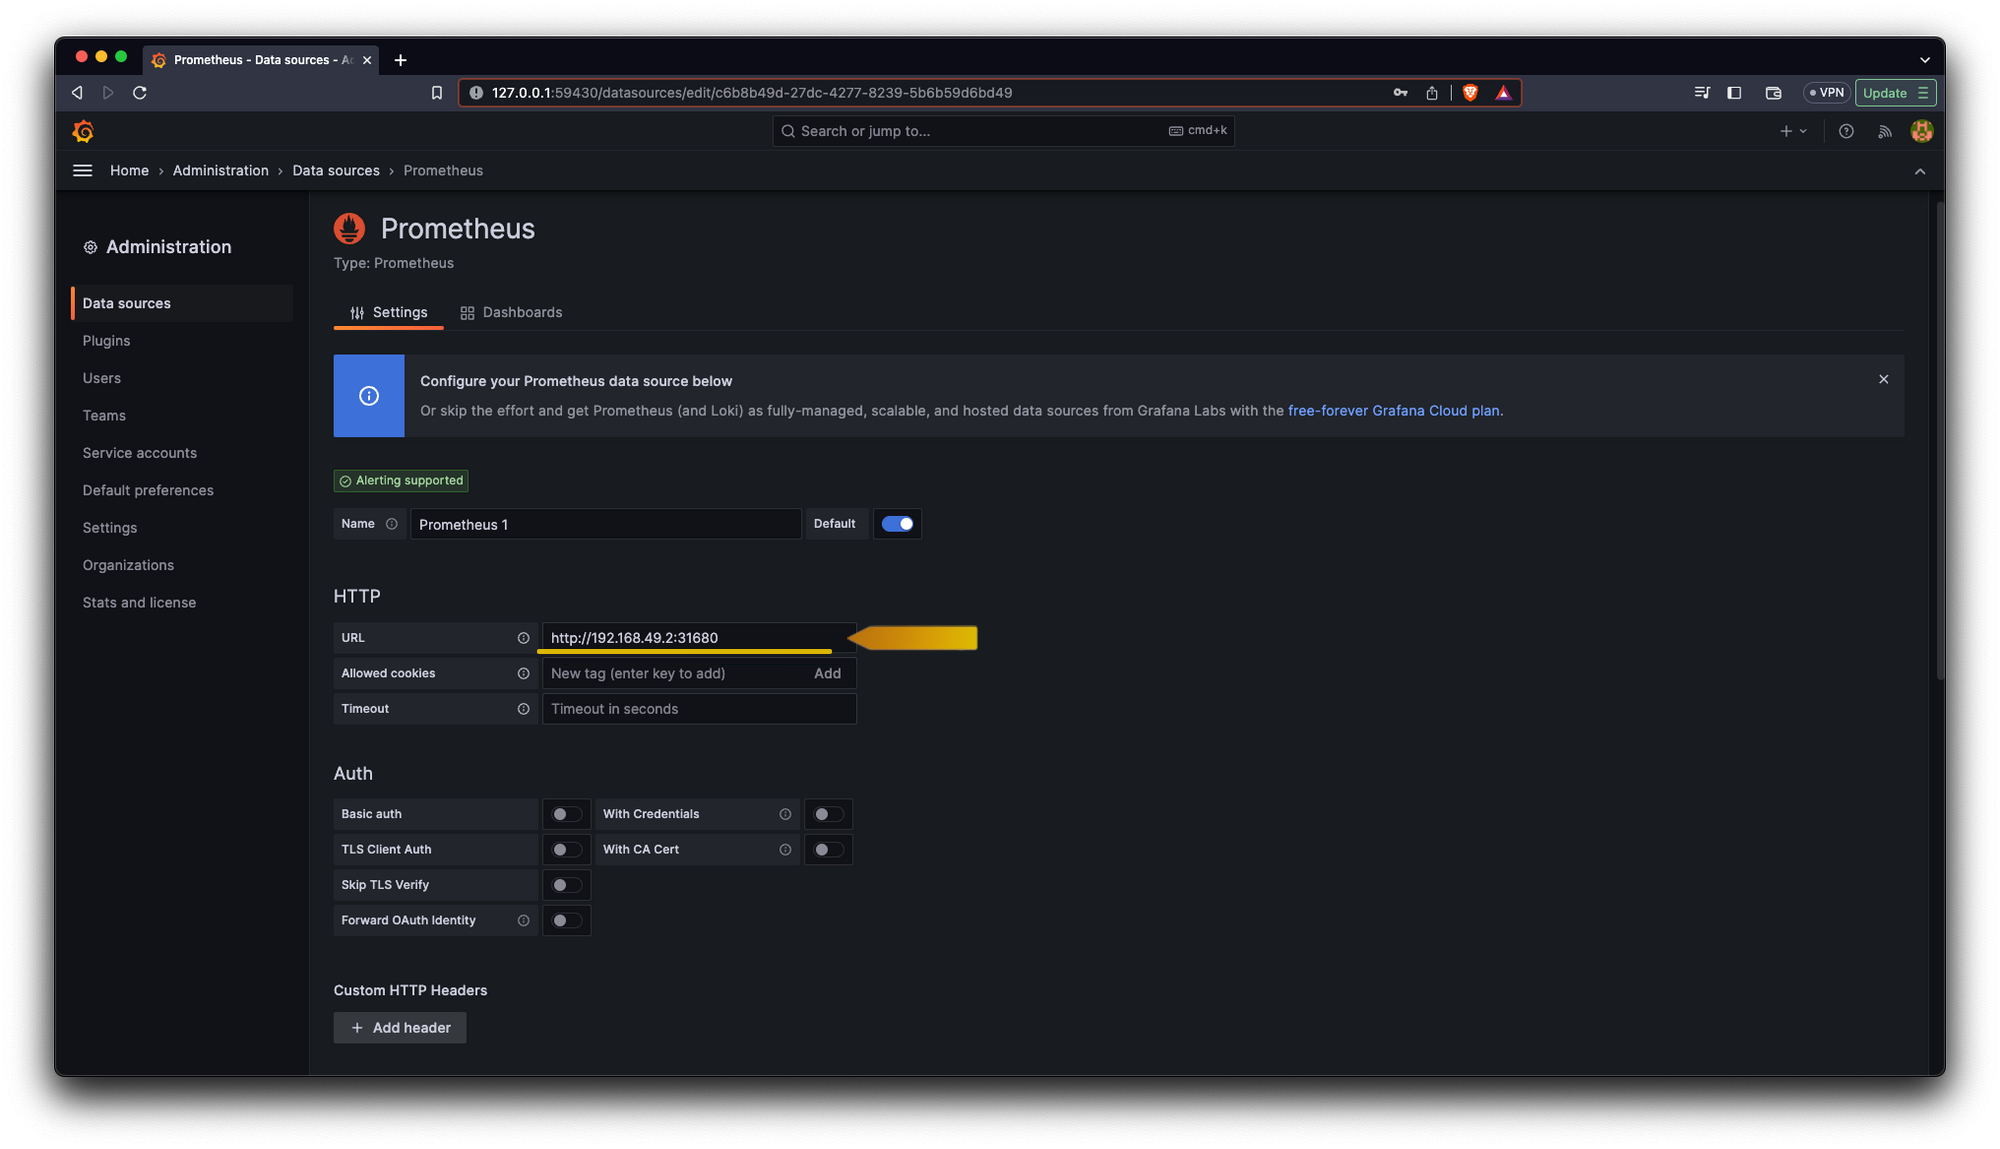
Now we need to connect our Grafana dashboard to our data source which is Prometheus:
Also, for our first Grafana dashboard we can use one already created, we can head to https://grafana.com/grafana/dashboards/ and search for “Kubernetes cluster monitoring (via Prometheus)” and we are gonna copy its id click the button Dashboard ID.
Once we have this id we need to import it in this direction /dashboard/import
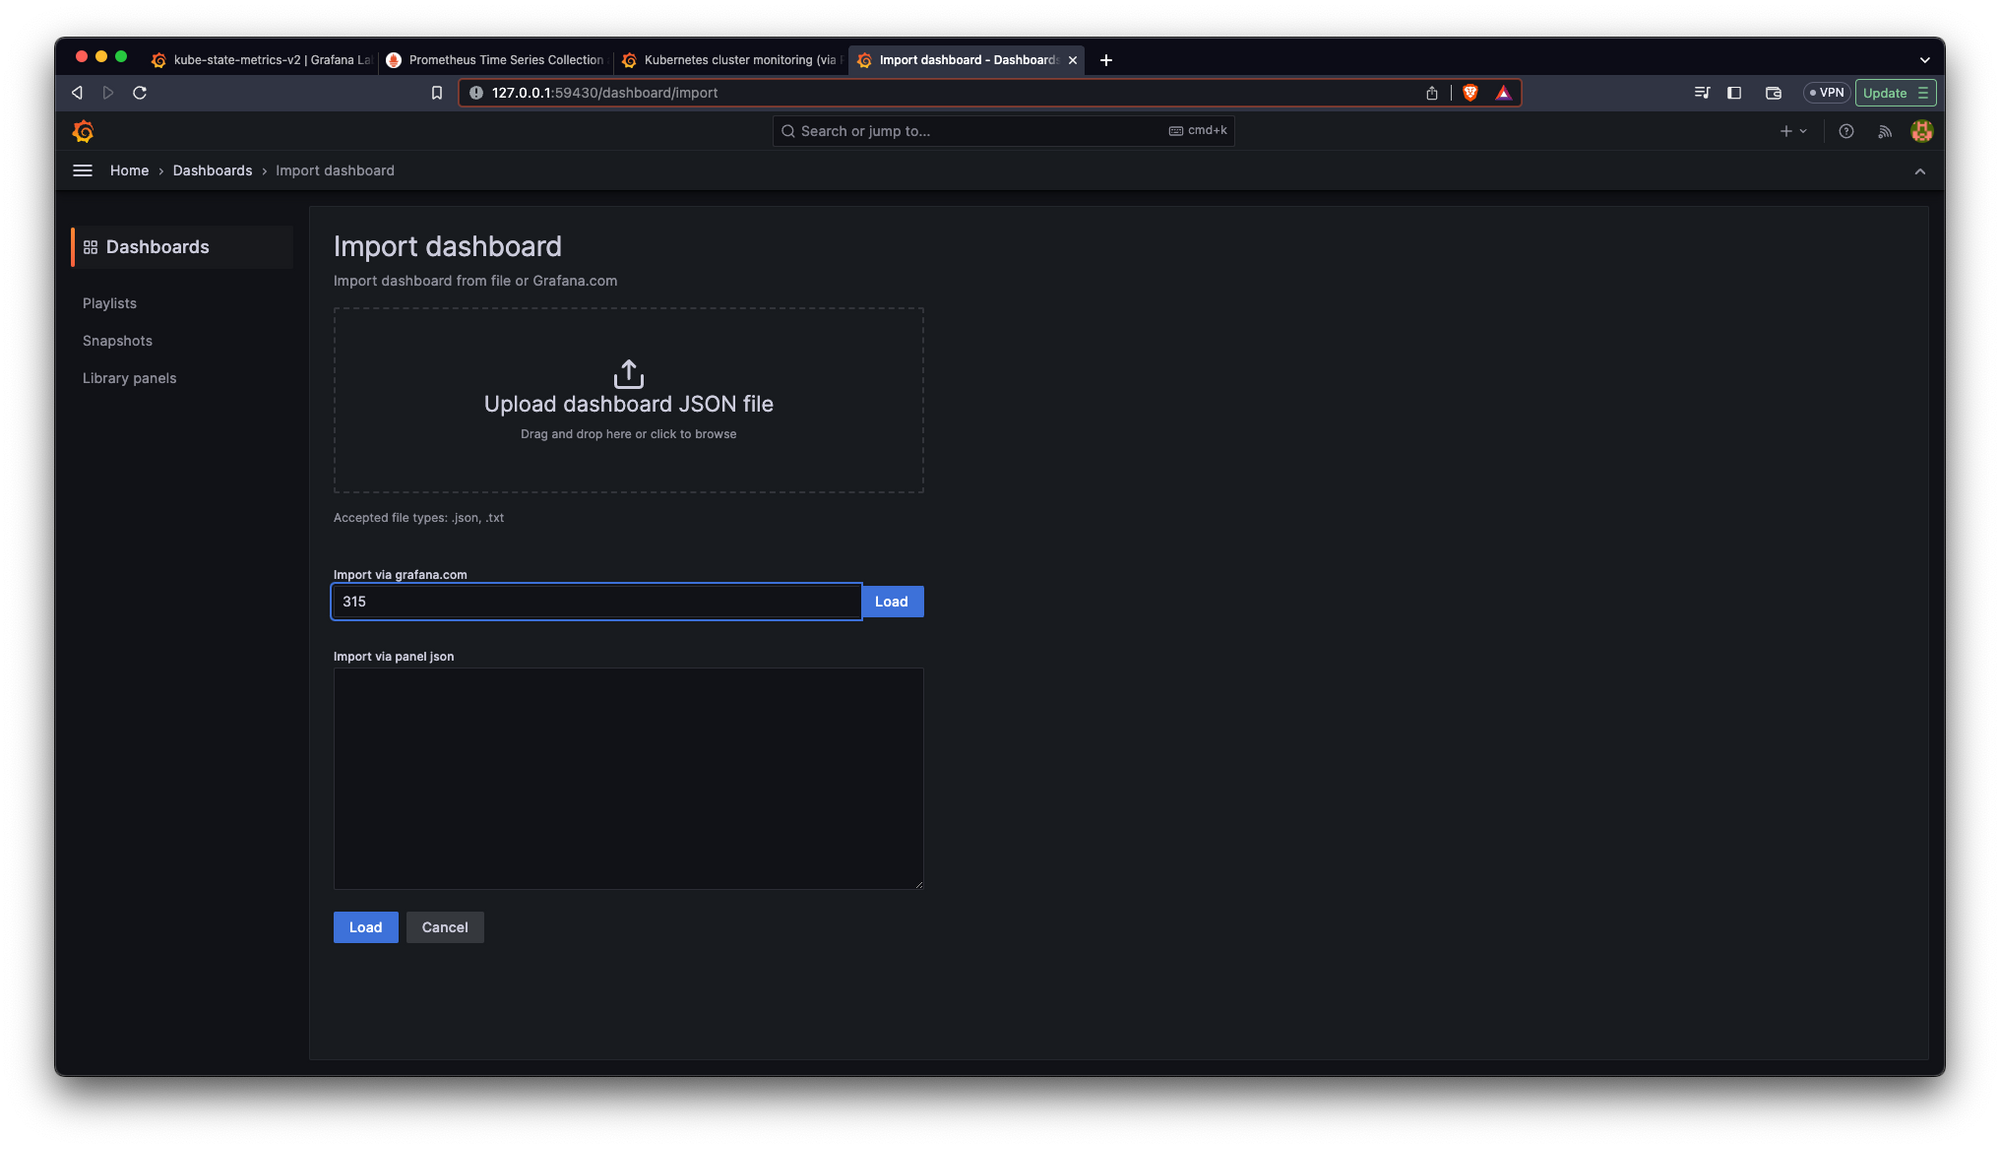
We click on Load and we will see the next screen
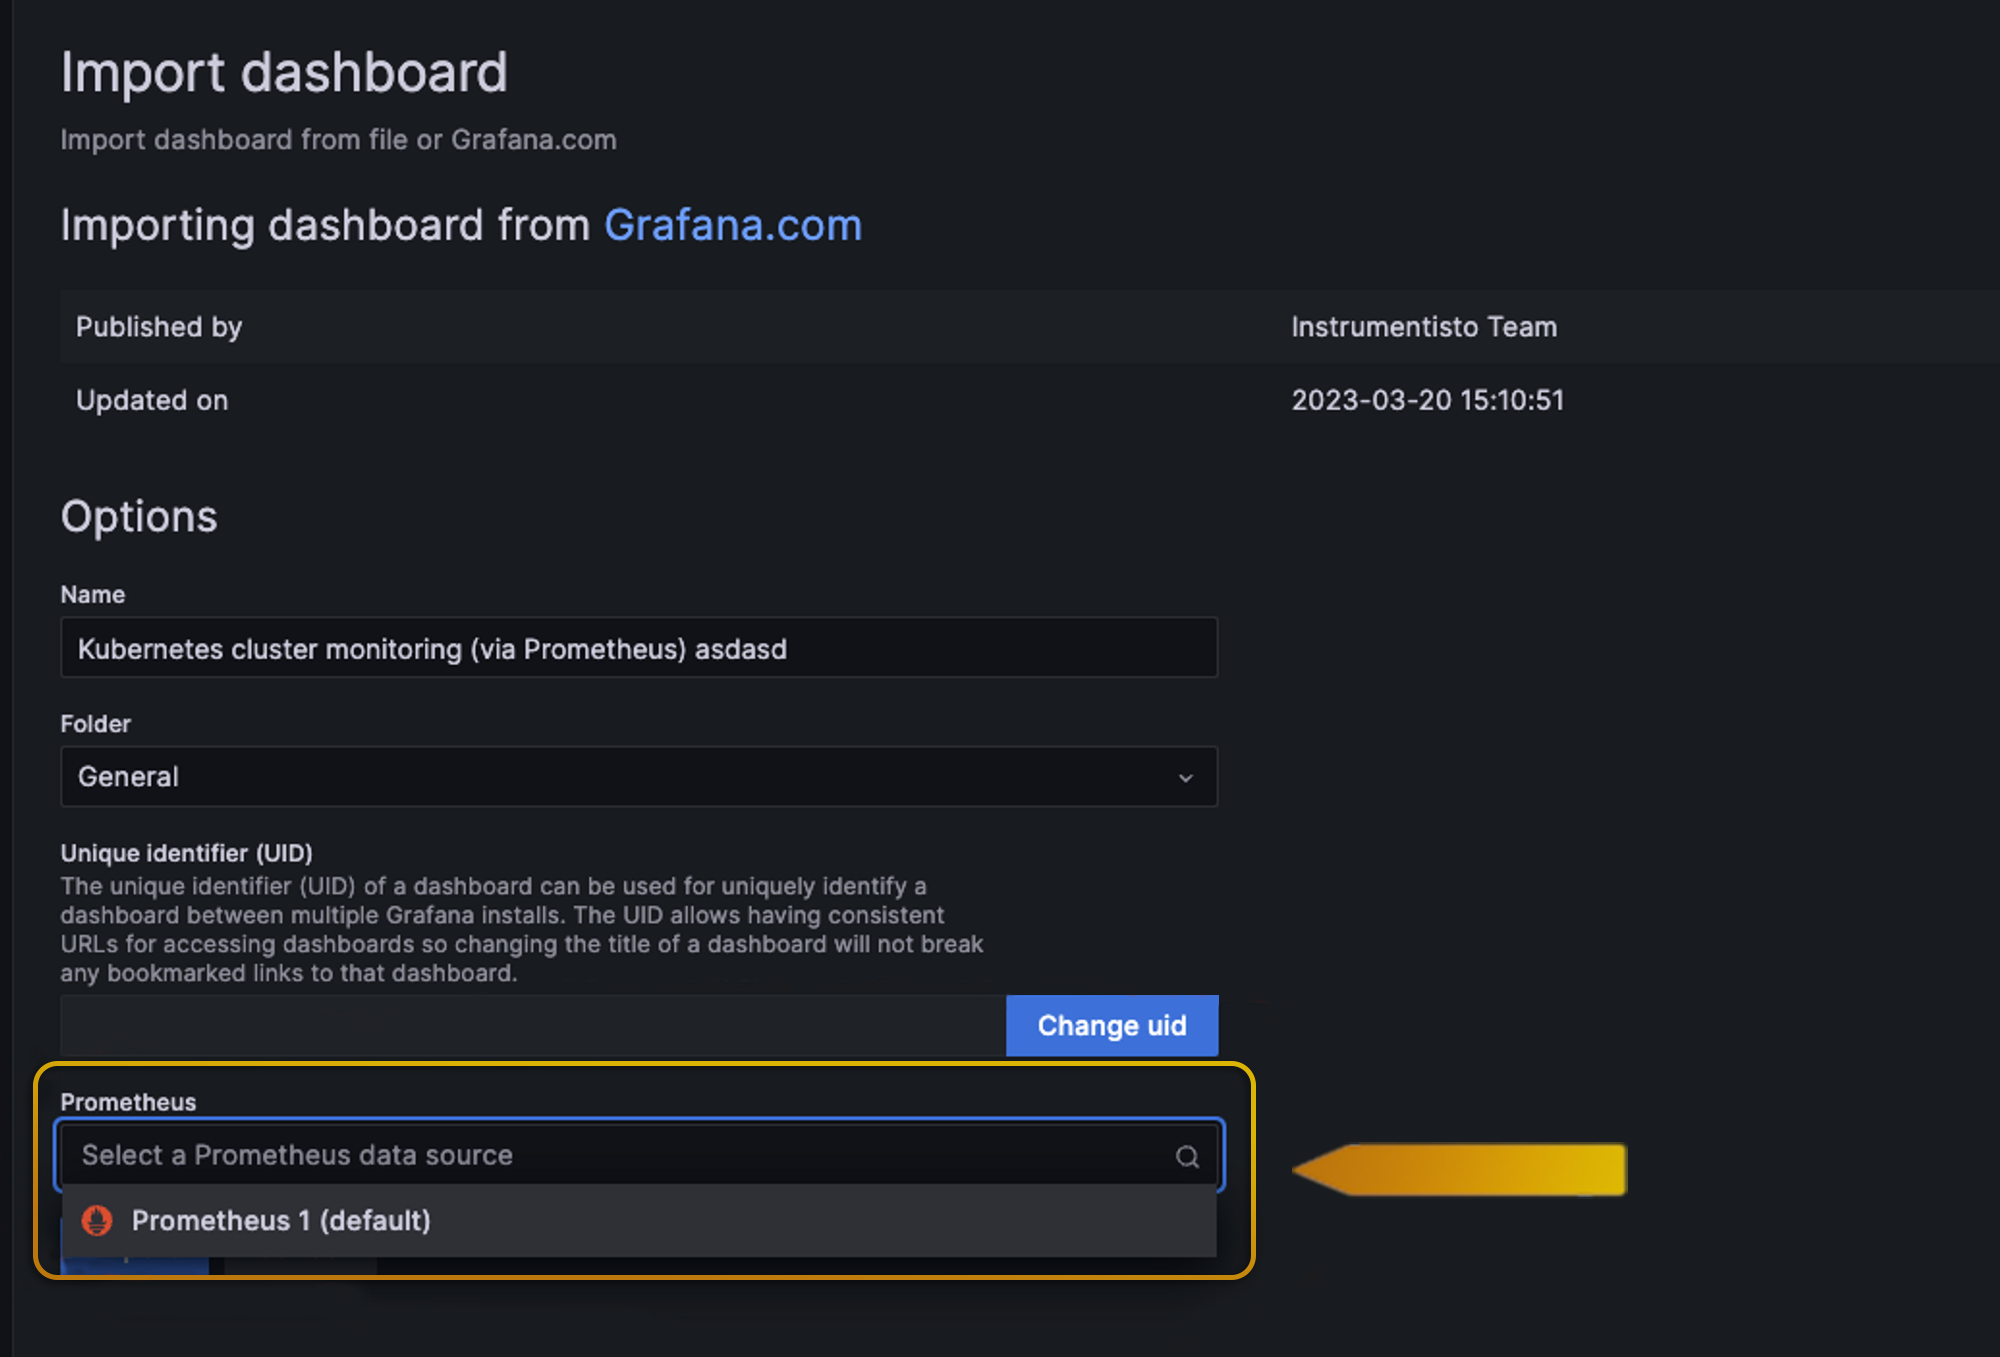
And here we select our data source which is the one that we previously created.
Here's the result:
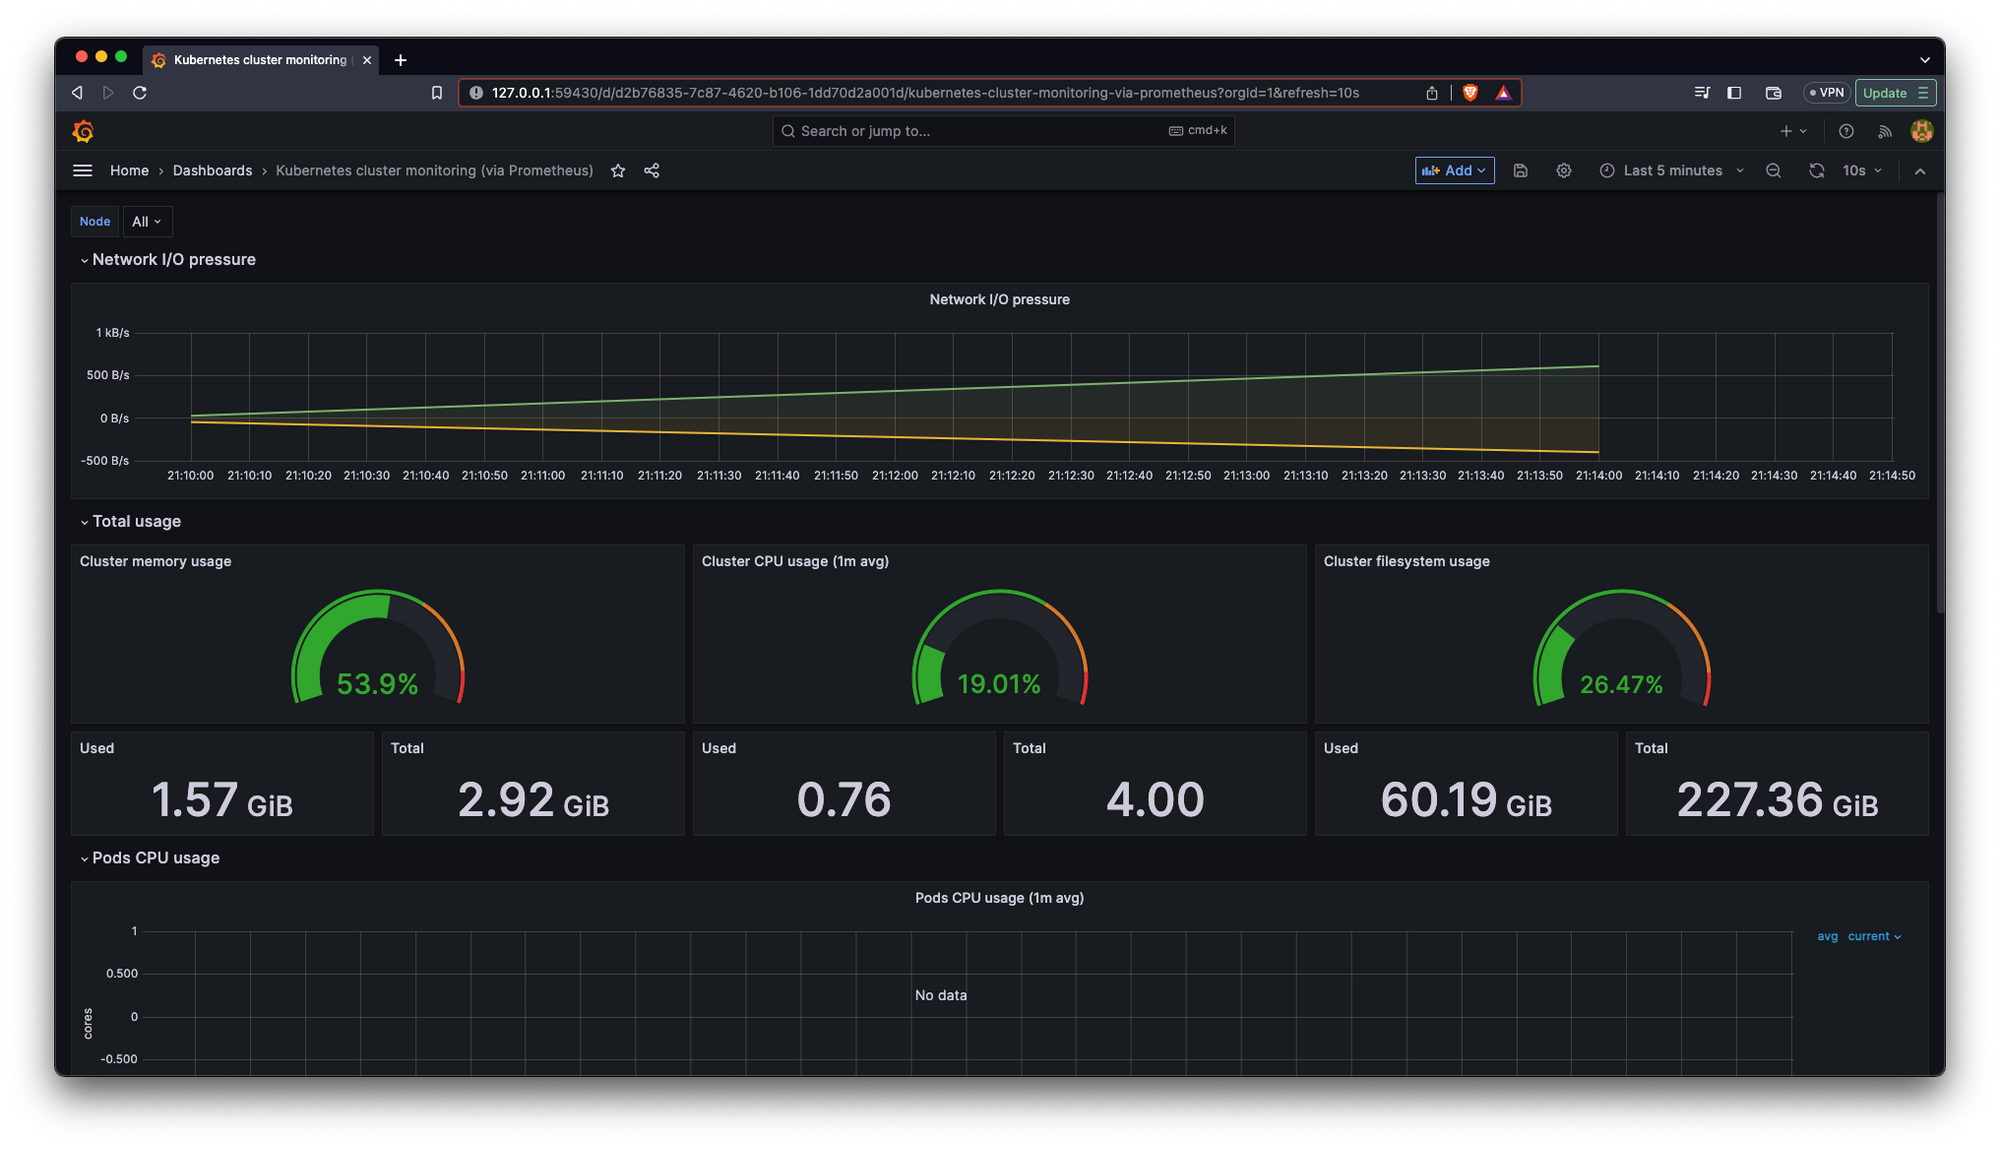
We have created our first dashboard using Grafana and Prometheus
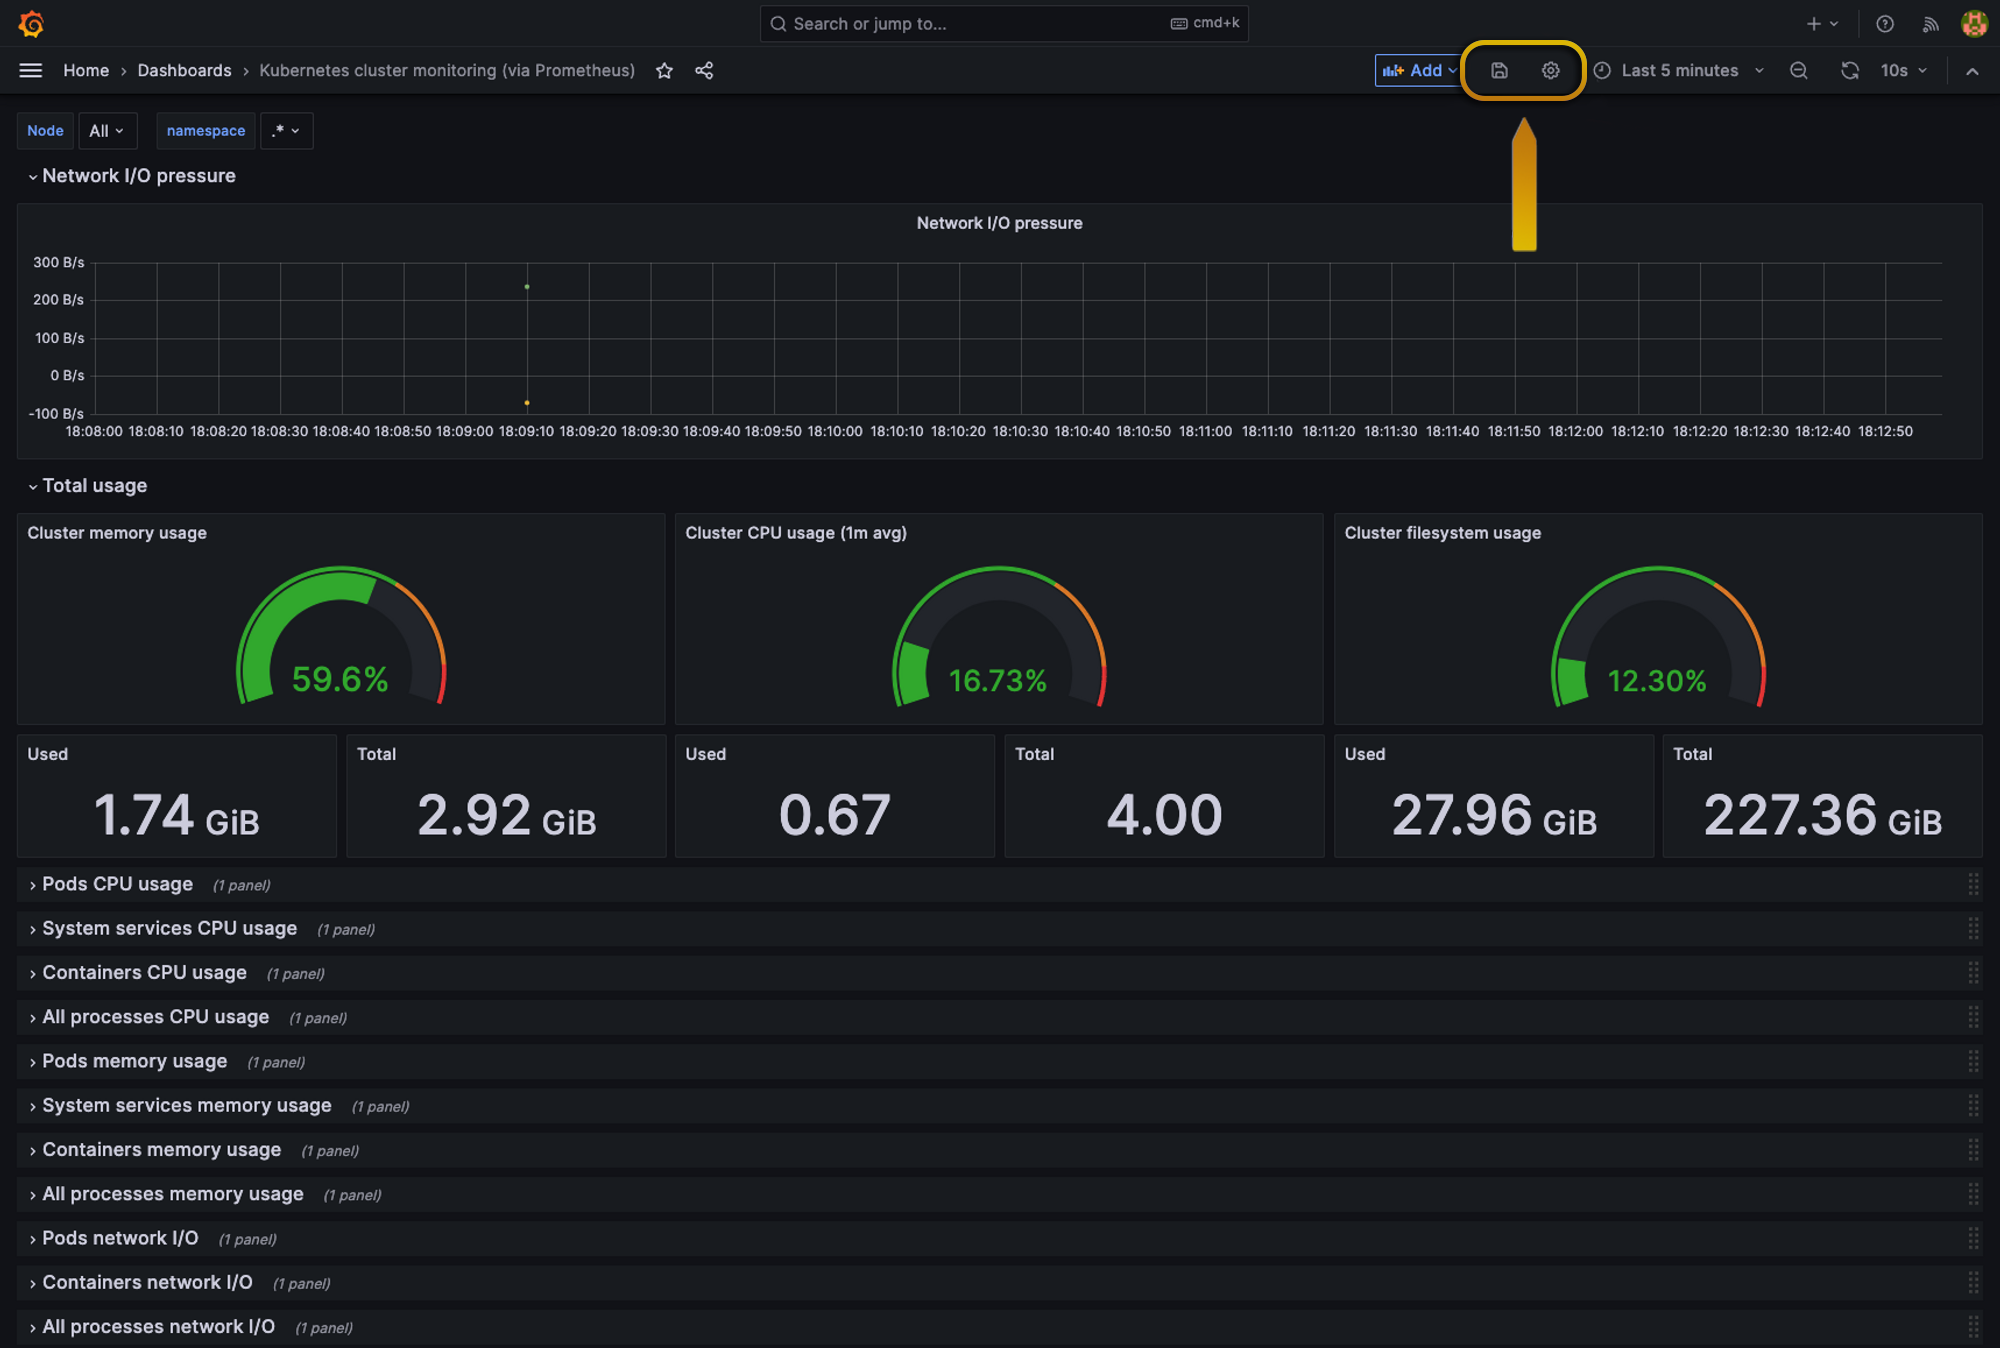
First, we’re gonna add a variable to our dashboard so we can use it in our new graphs. To be exact we are gonna create a “namespace” variable so we can filter graphs only by a given namespace.
Then we’re going to head to our dashboard settings:
Once inside settings, we’re going to head to variables and click Add new variable
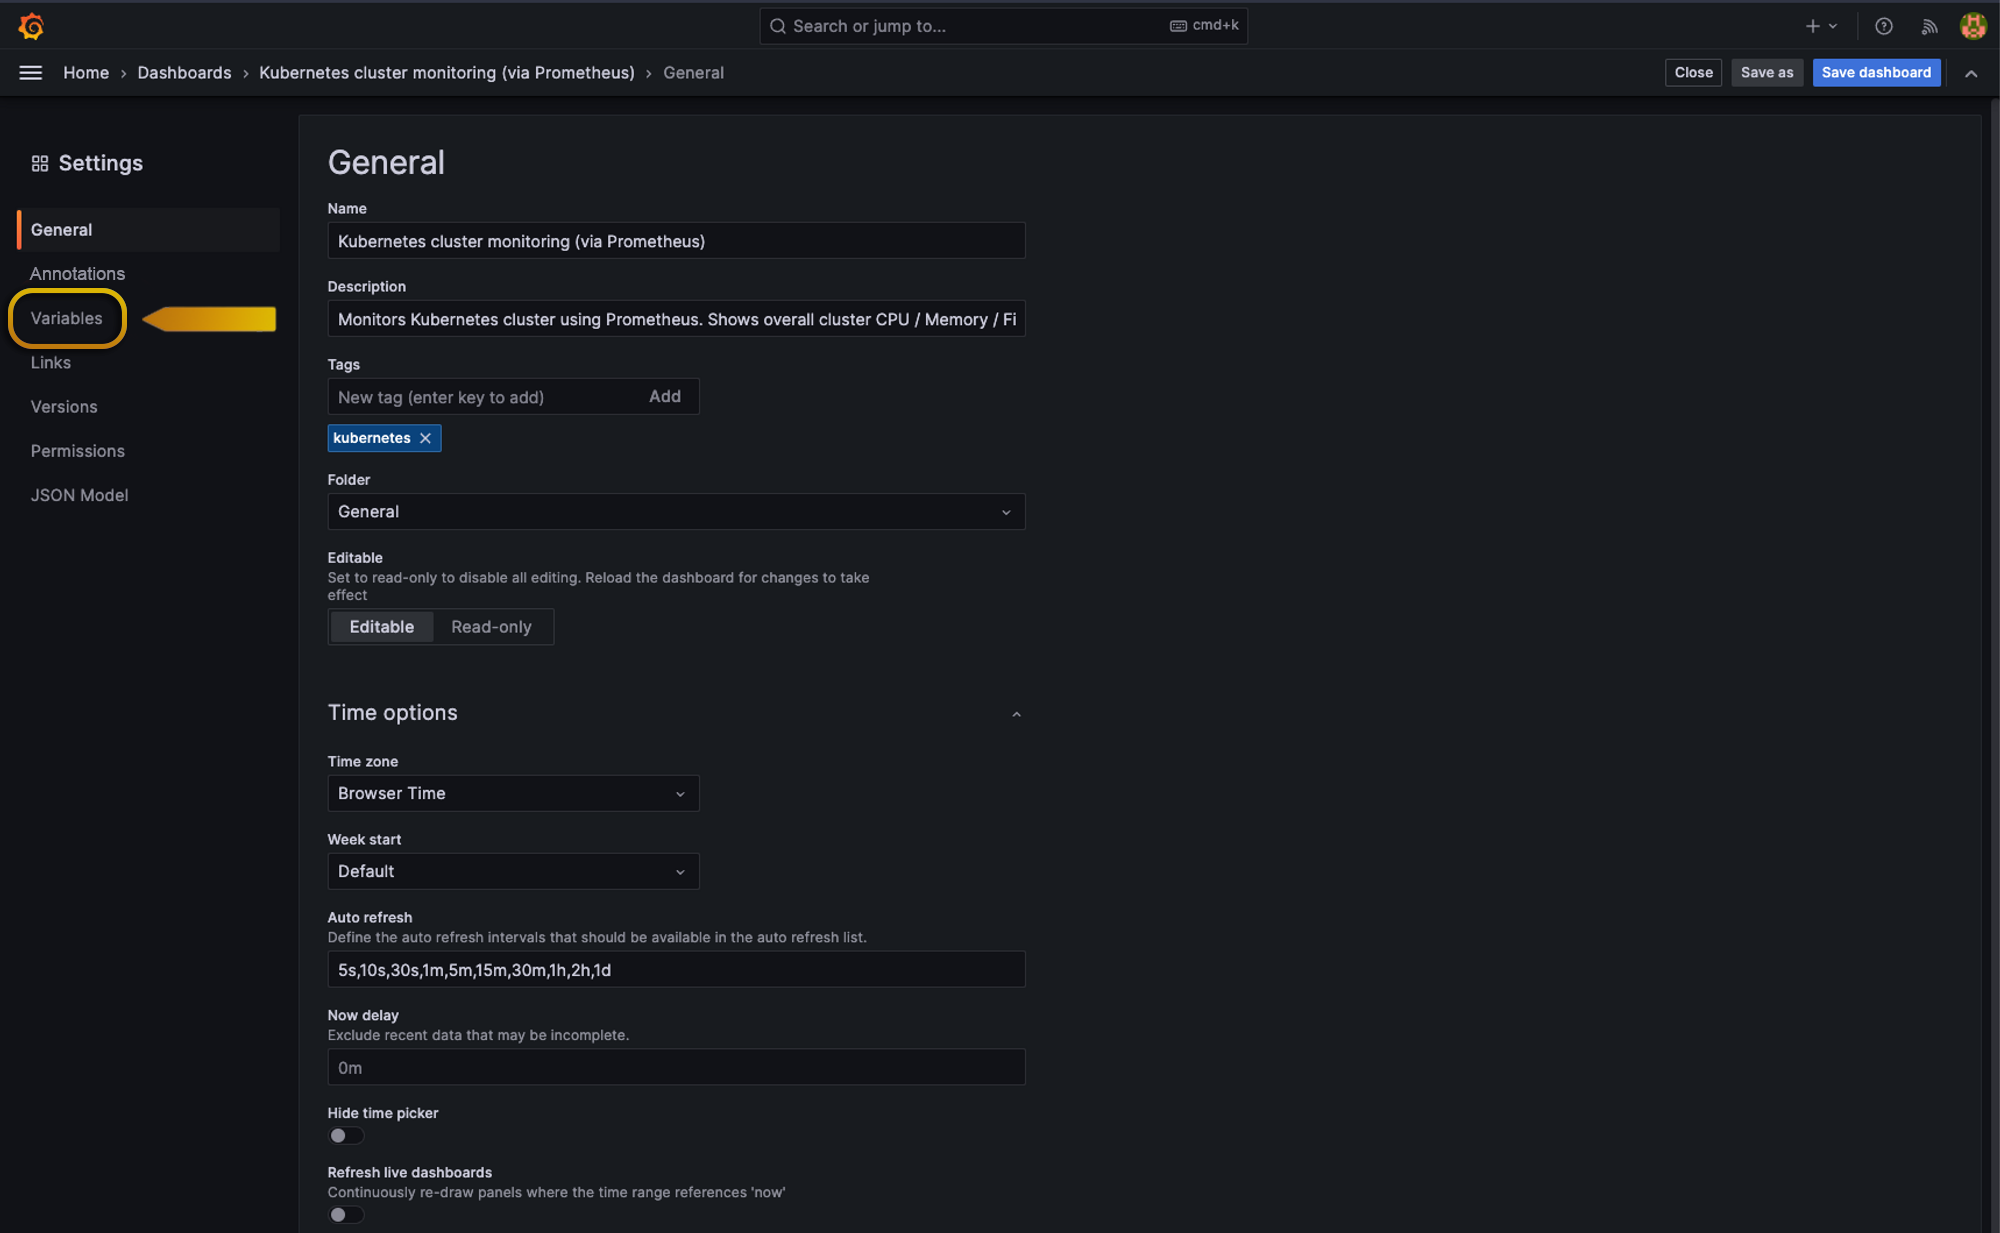
So, inside variables, we have a few types of Queries
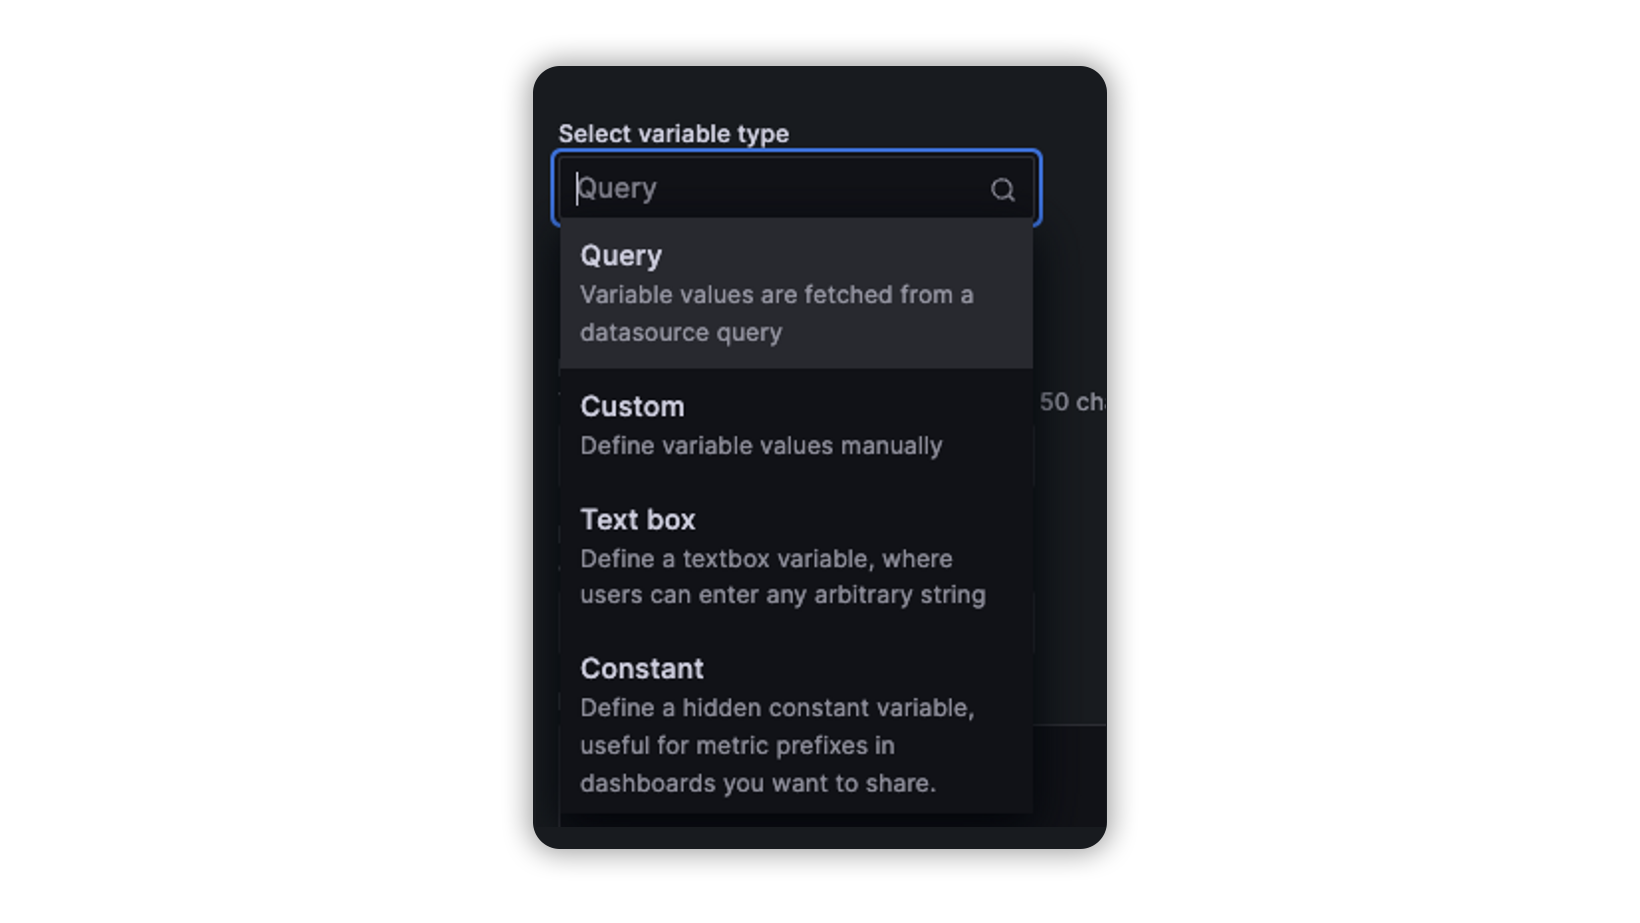
For this example, we’re gonna use the query type, as its description says this allows us to query directly our data source to retrieve the values we need, in this case, we’re gonna need to query all the namespaces in our Kubernetes cluster.
So after setting the variable name, label, and description we’re gonna go down to Query options, this is where we set our query.
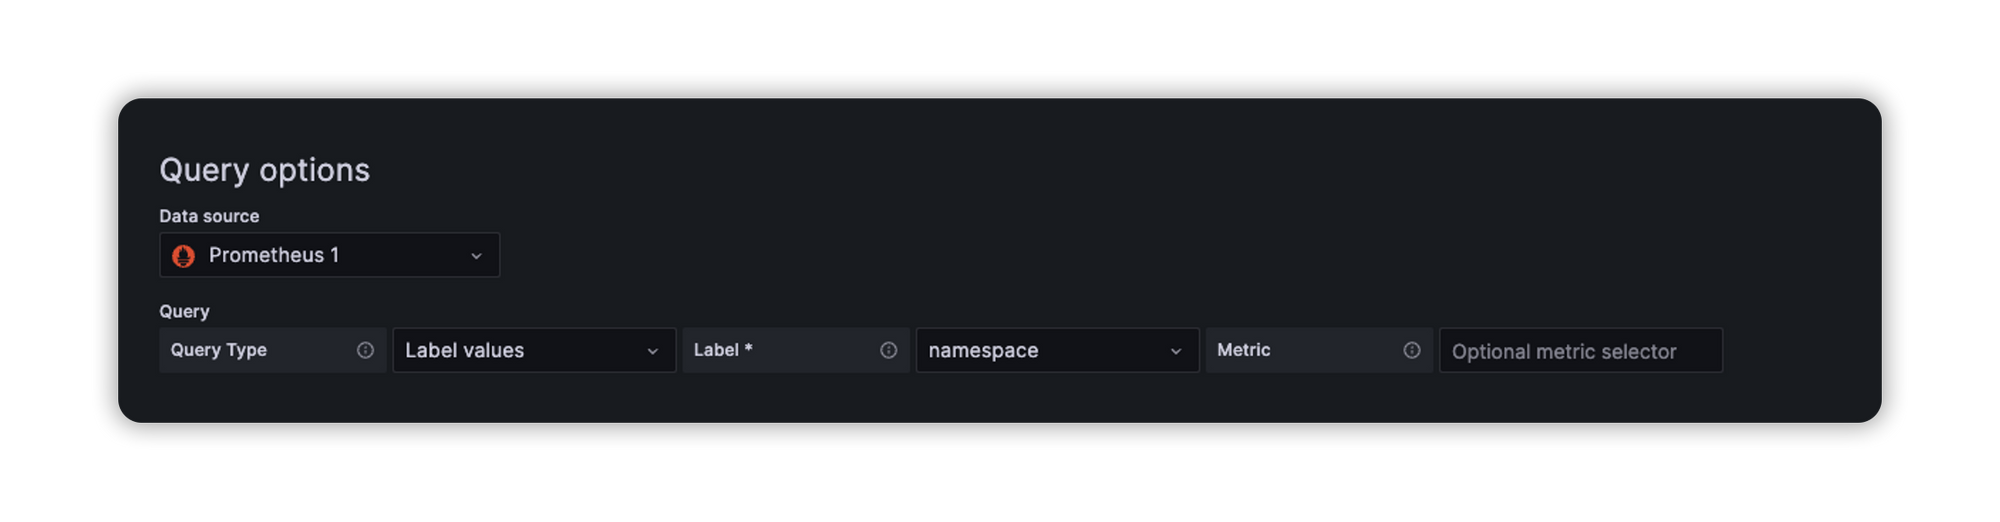
As you can see first we select our data source in this case is our running prometheus service, in query type, we select Label values because we want our query result to fetch our dropdown basically, and right after that we select the object that we need, in this case is namespace, this should return a list of namespaces from that cluster.
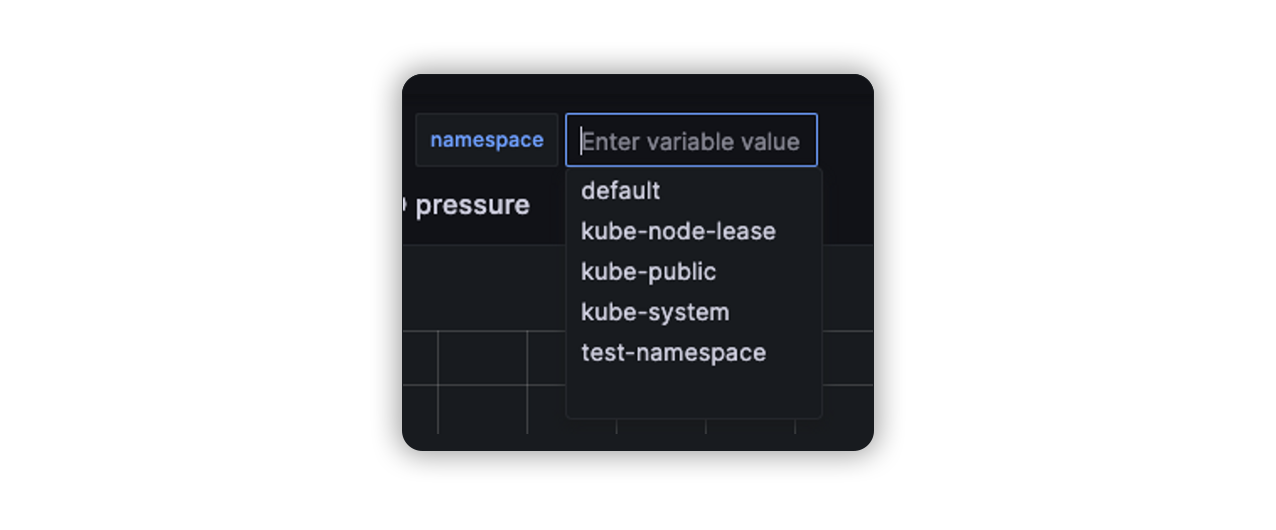
After we create the variable we should see something like this, the value of this dropdown is usable in our graphs, we will see how to use it later.
So what we’re gonna do for our new graph is to list all the deployment replicas in our cluster, we need to see the time of the creation of that deployment, the deployment name, and how many replicas it has also we want to be able to filter it using our namespace variable, first we need to build a query for that:
// Fetch all series matching metric name and label filters.
kube_deployment_status_replicas{namespace=~".*"}
We can go ahead and open our Prometheus app and test that promQL query to see what it returns
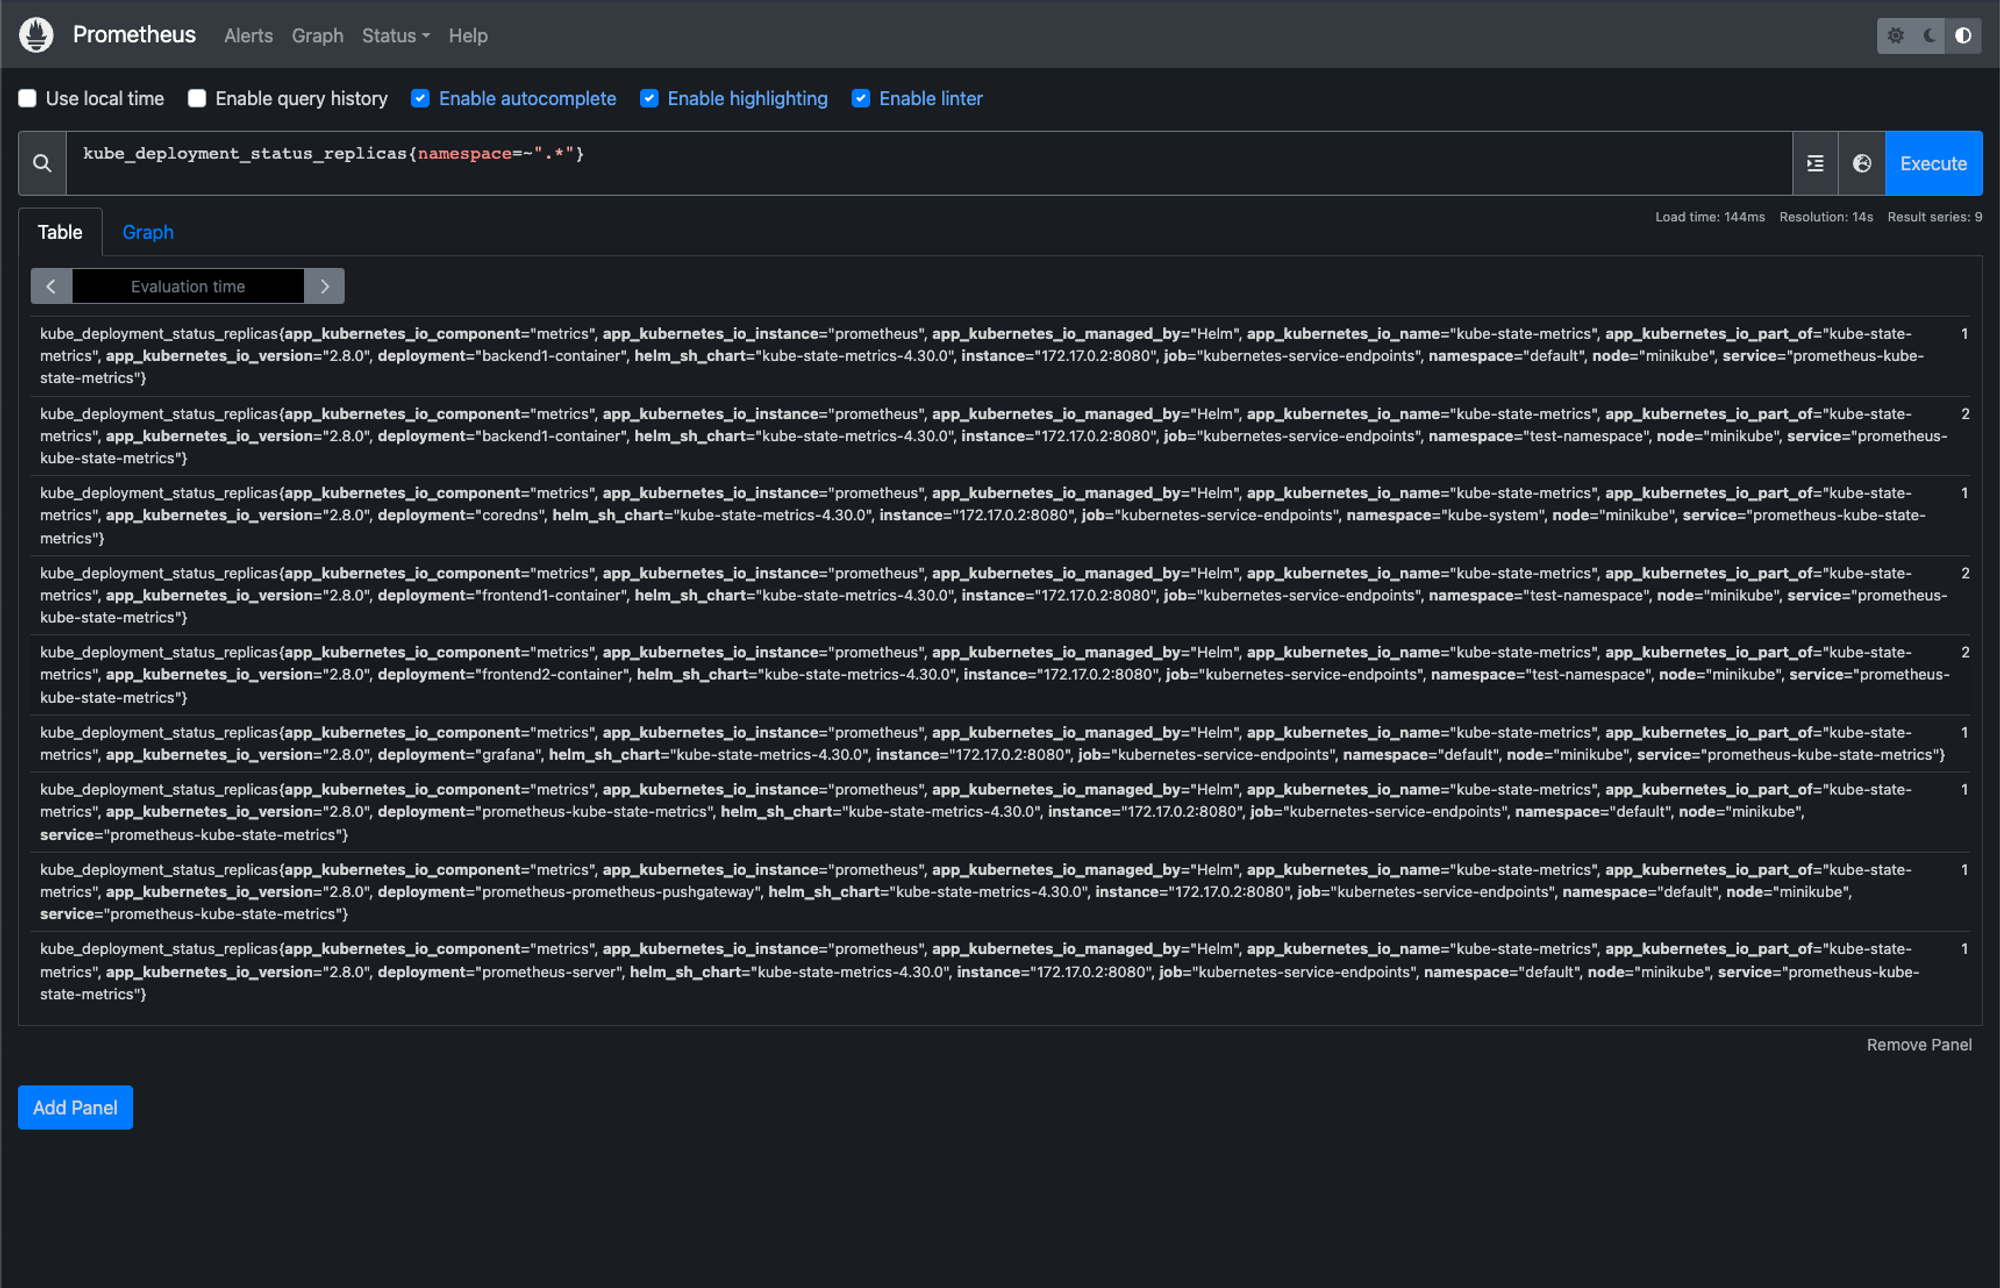
As you can see it returns us everything we need for our graph
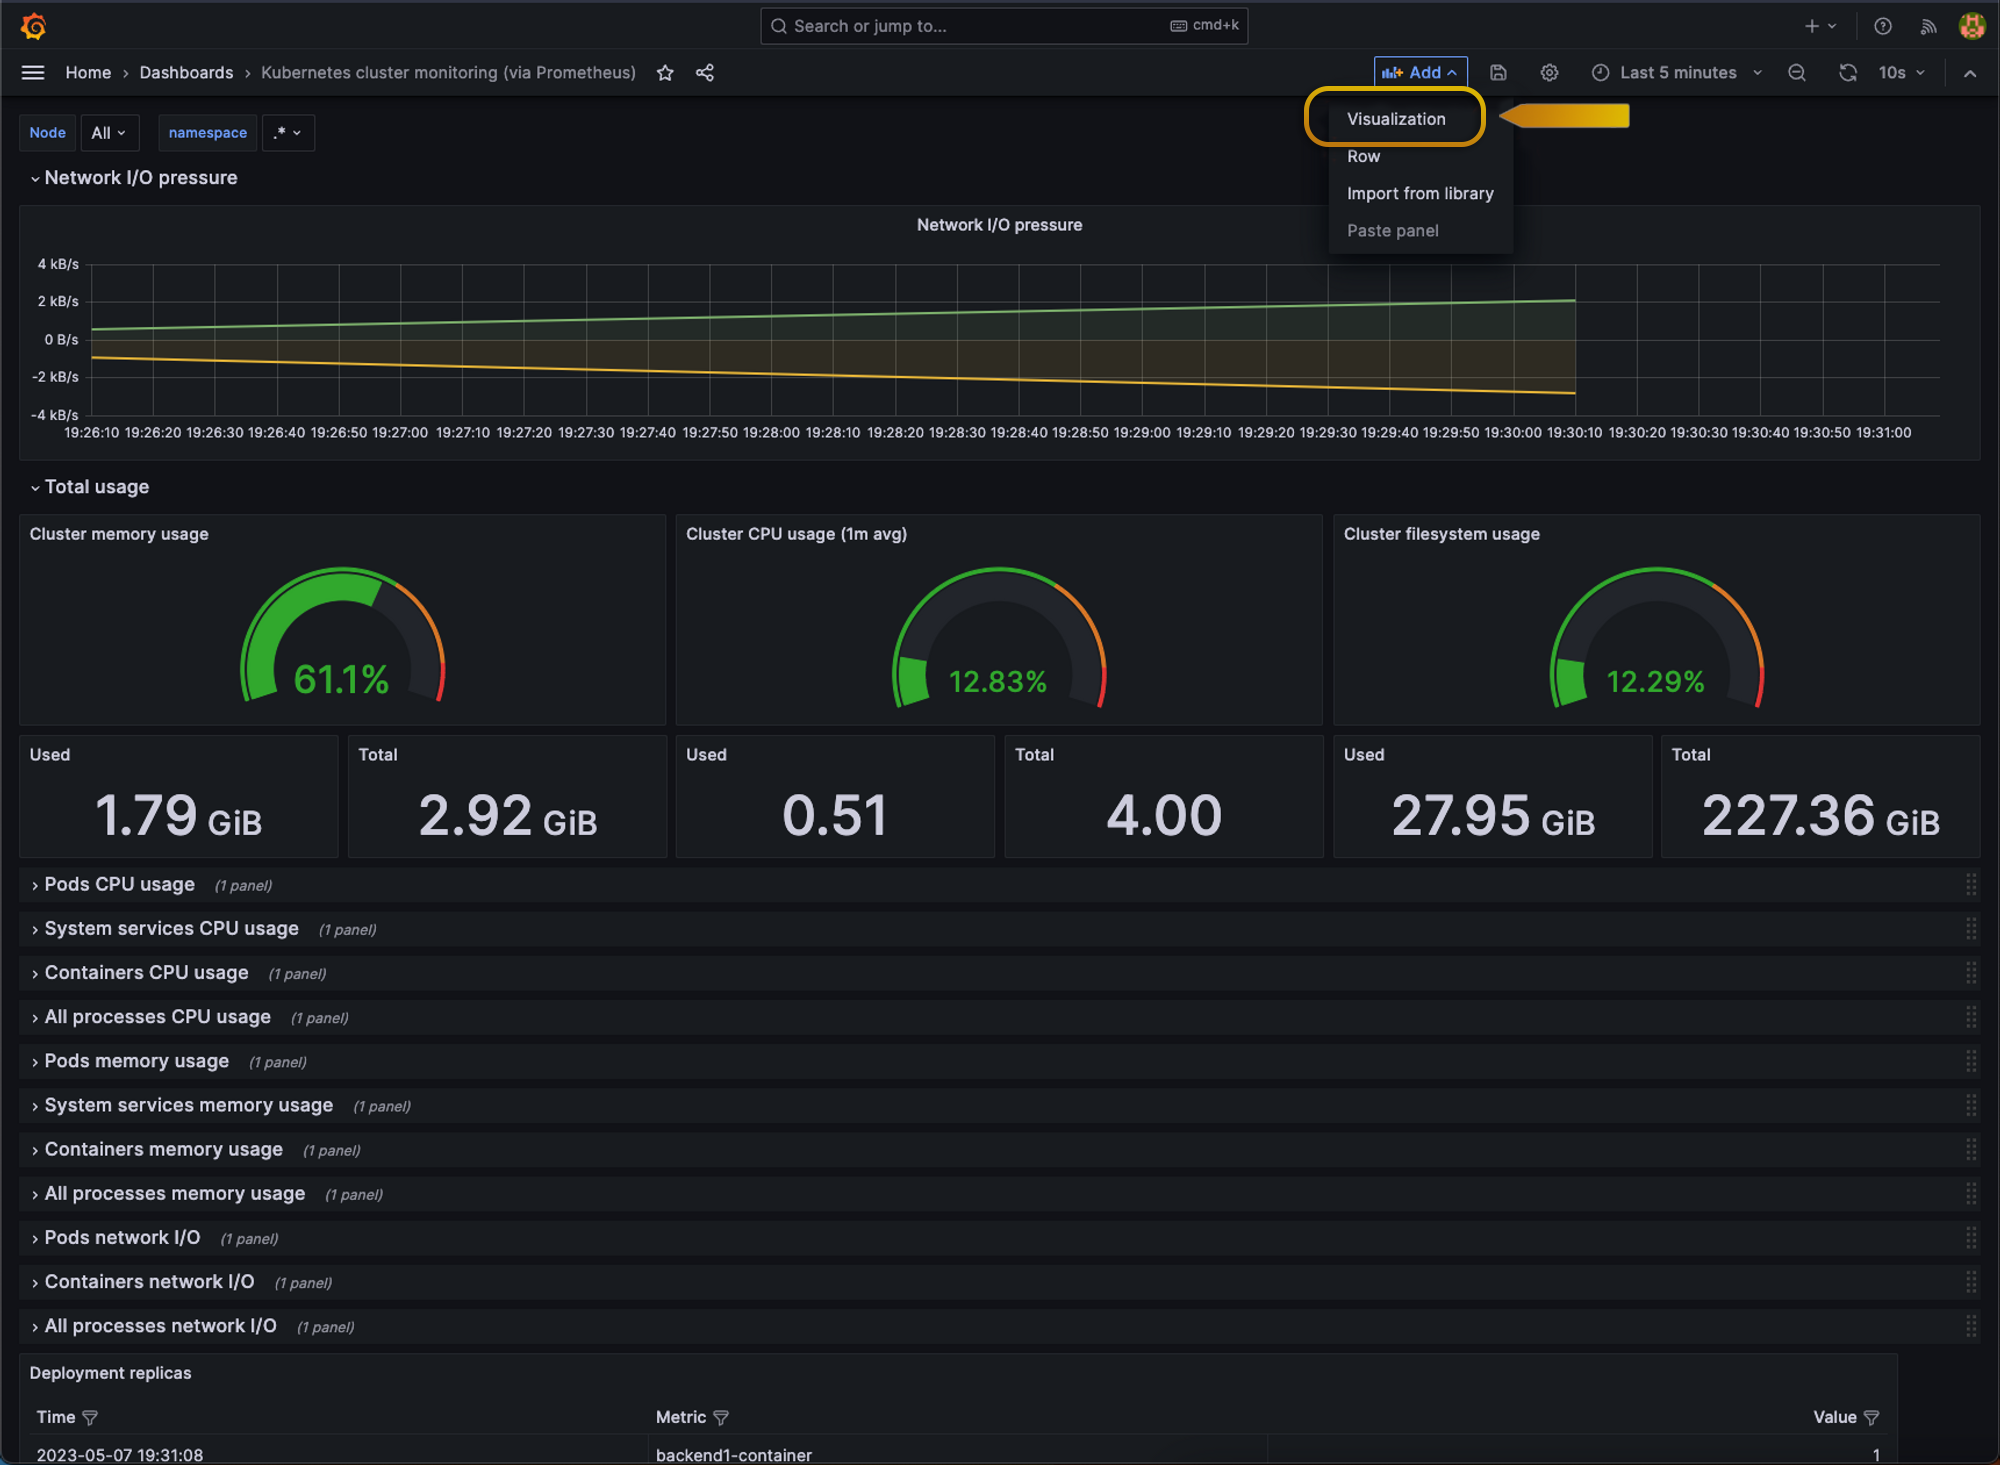
To add a new graph we will head to the Add Button at the top of our dashboard and select visualization:
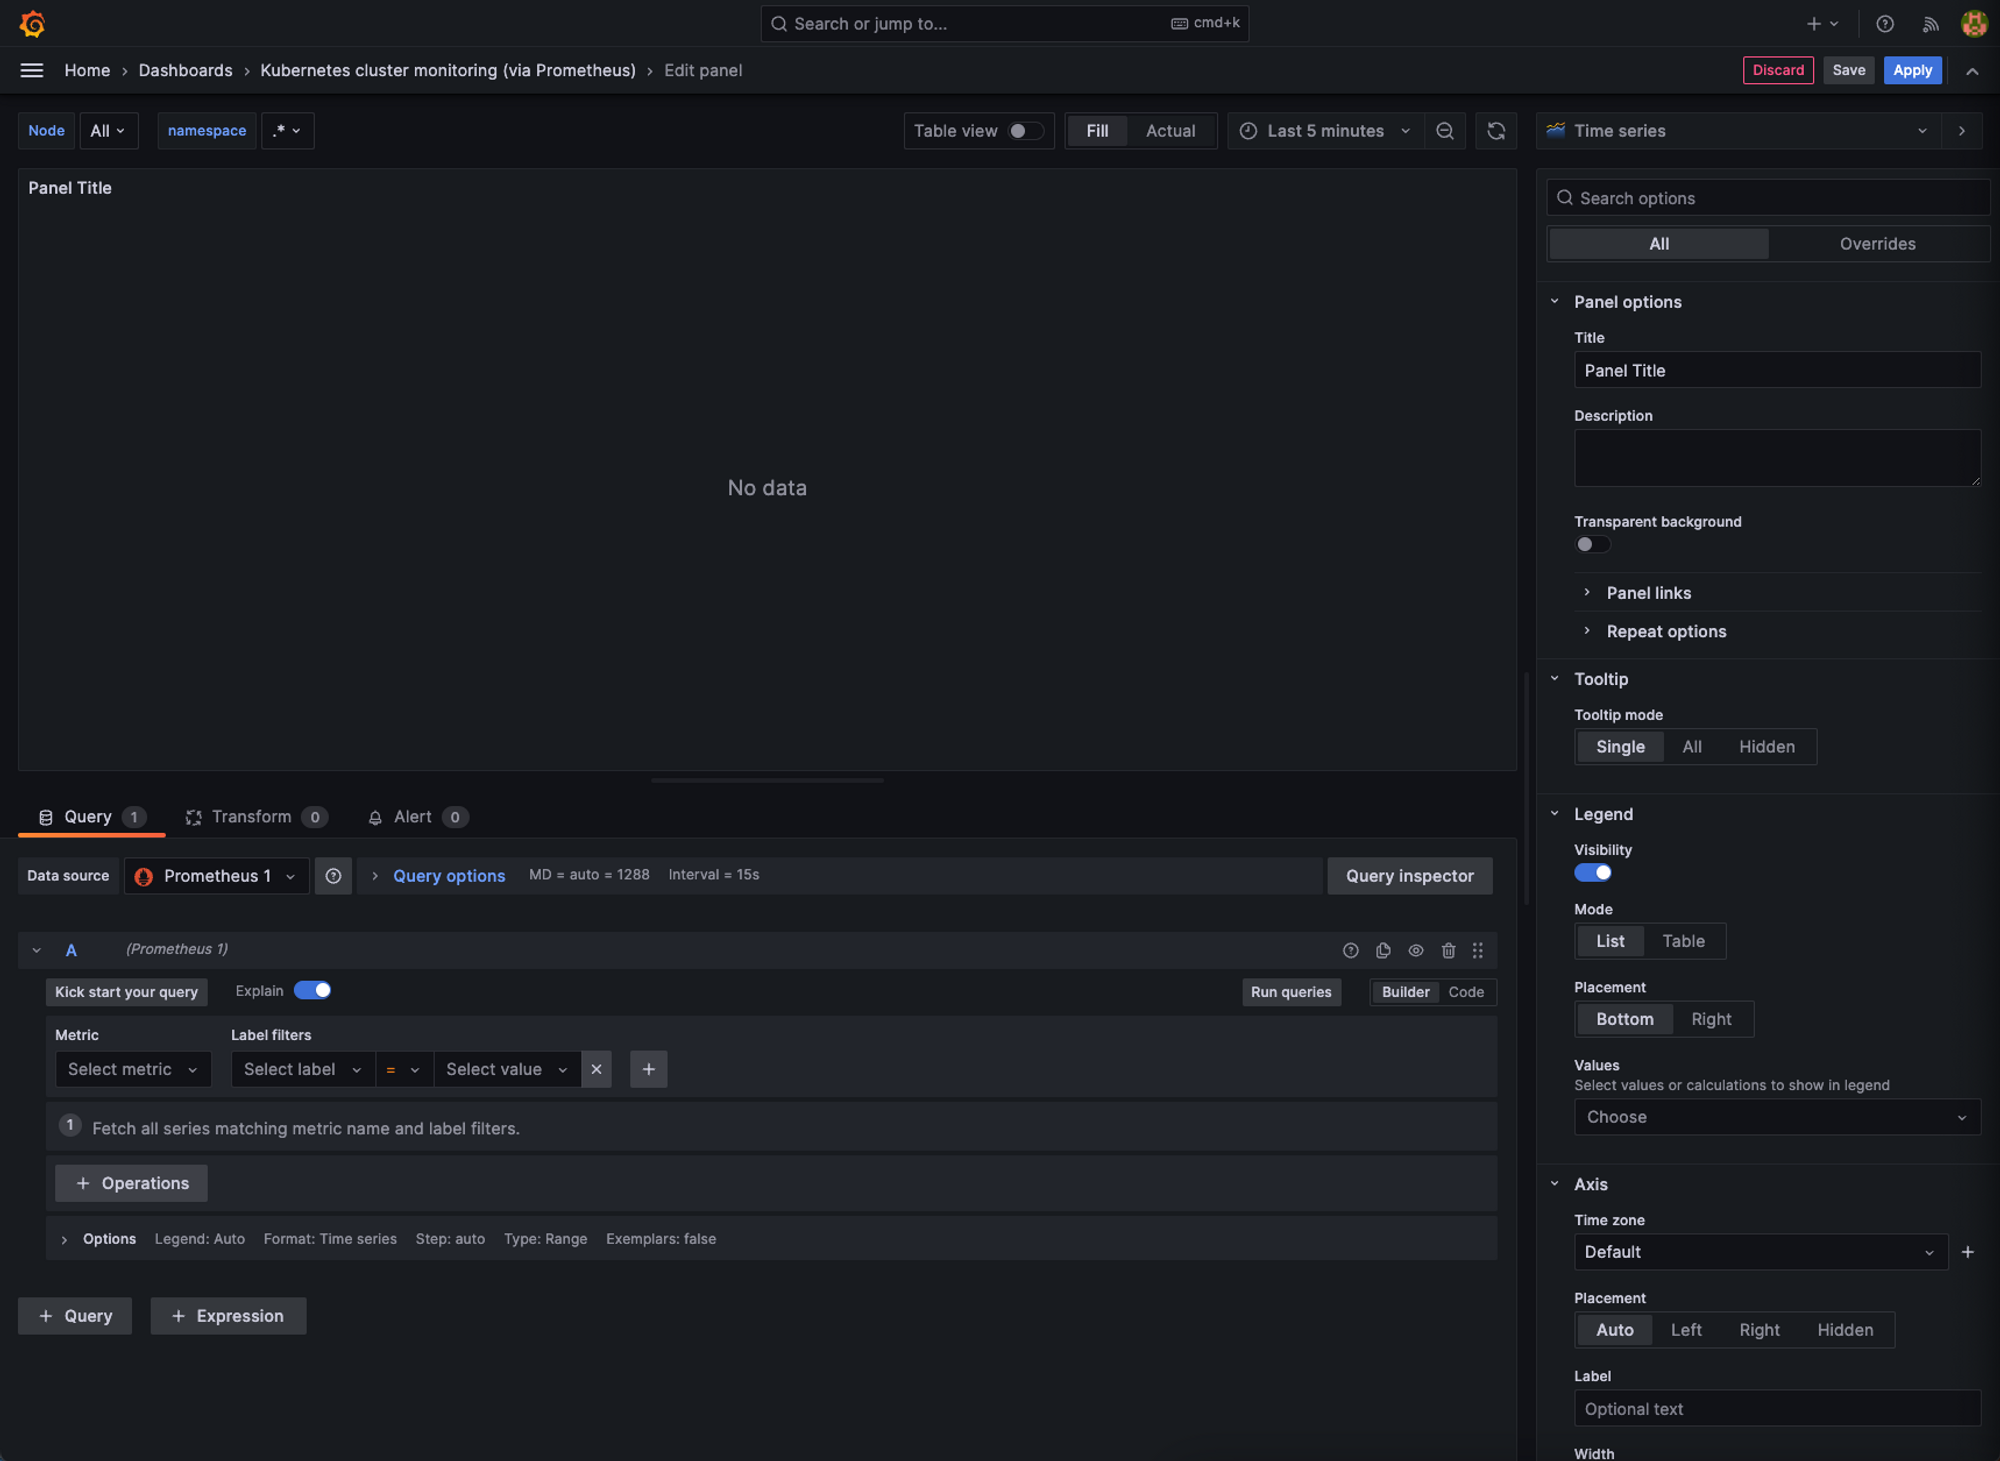
Alright, so this is our edit panel, this is where we’re gonna configure or graph
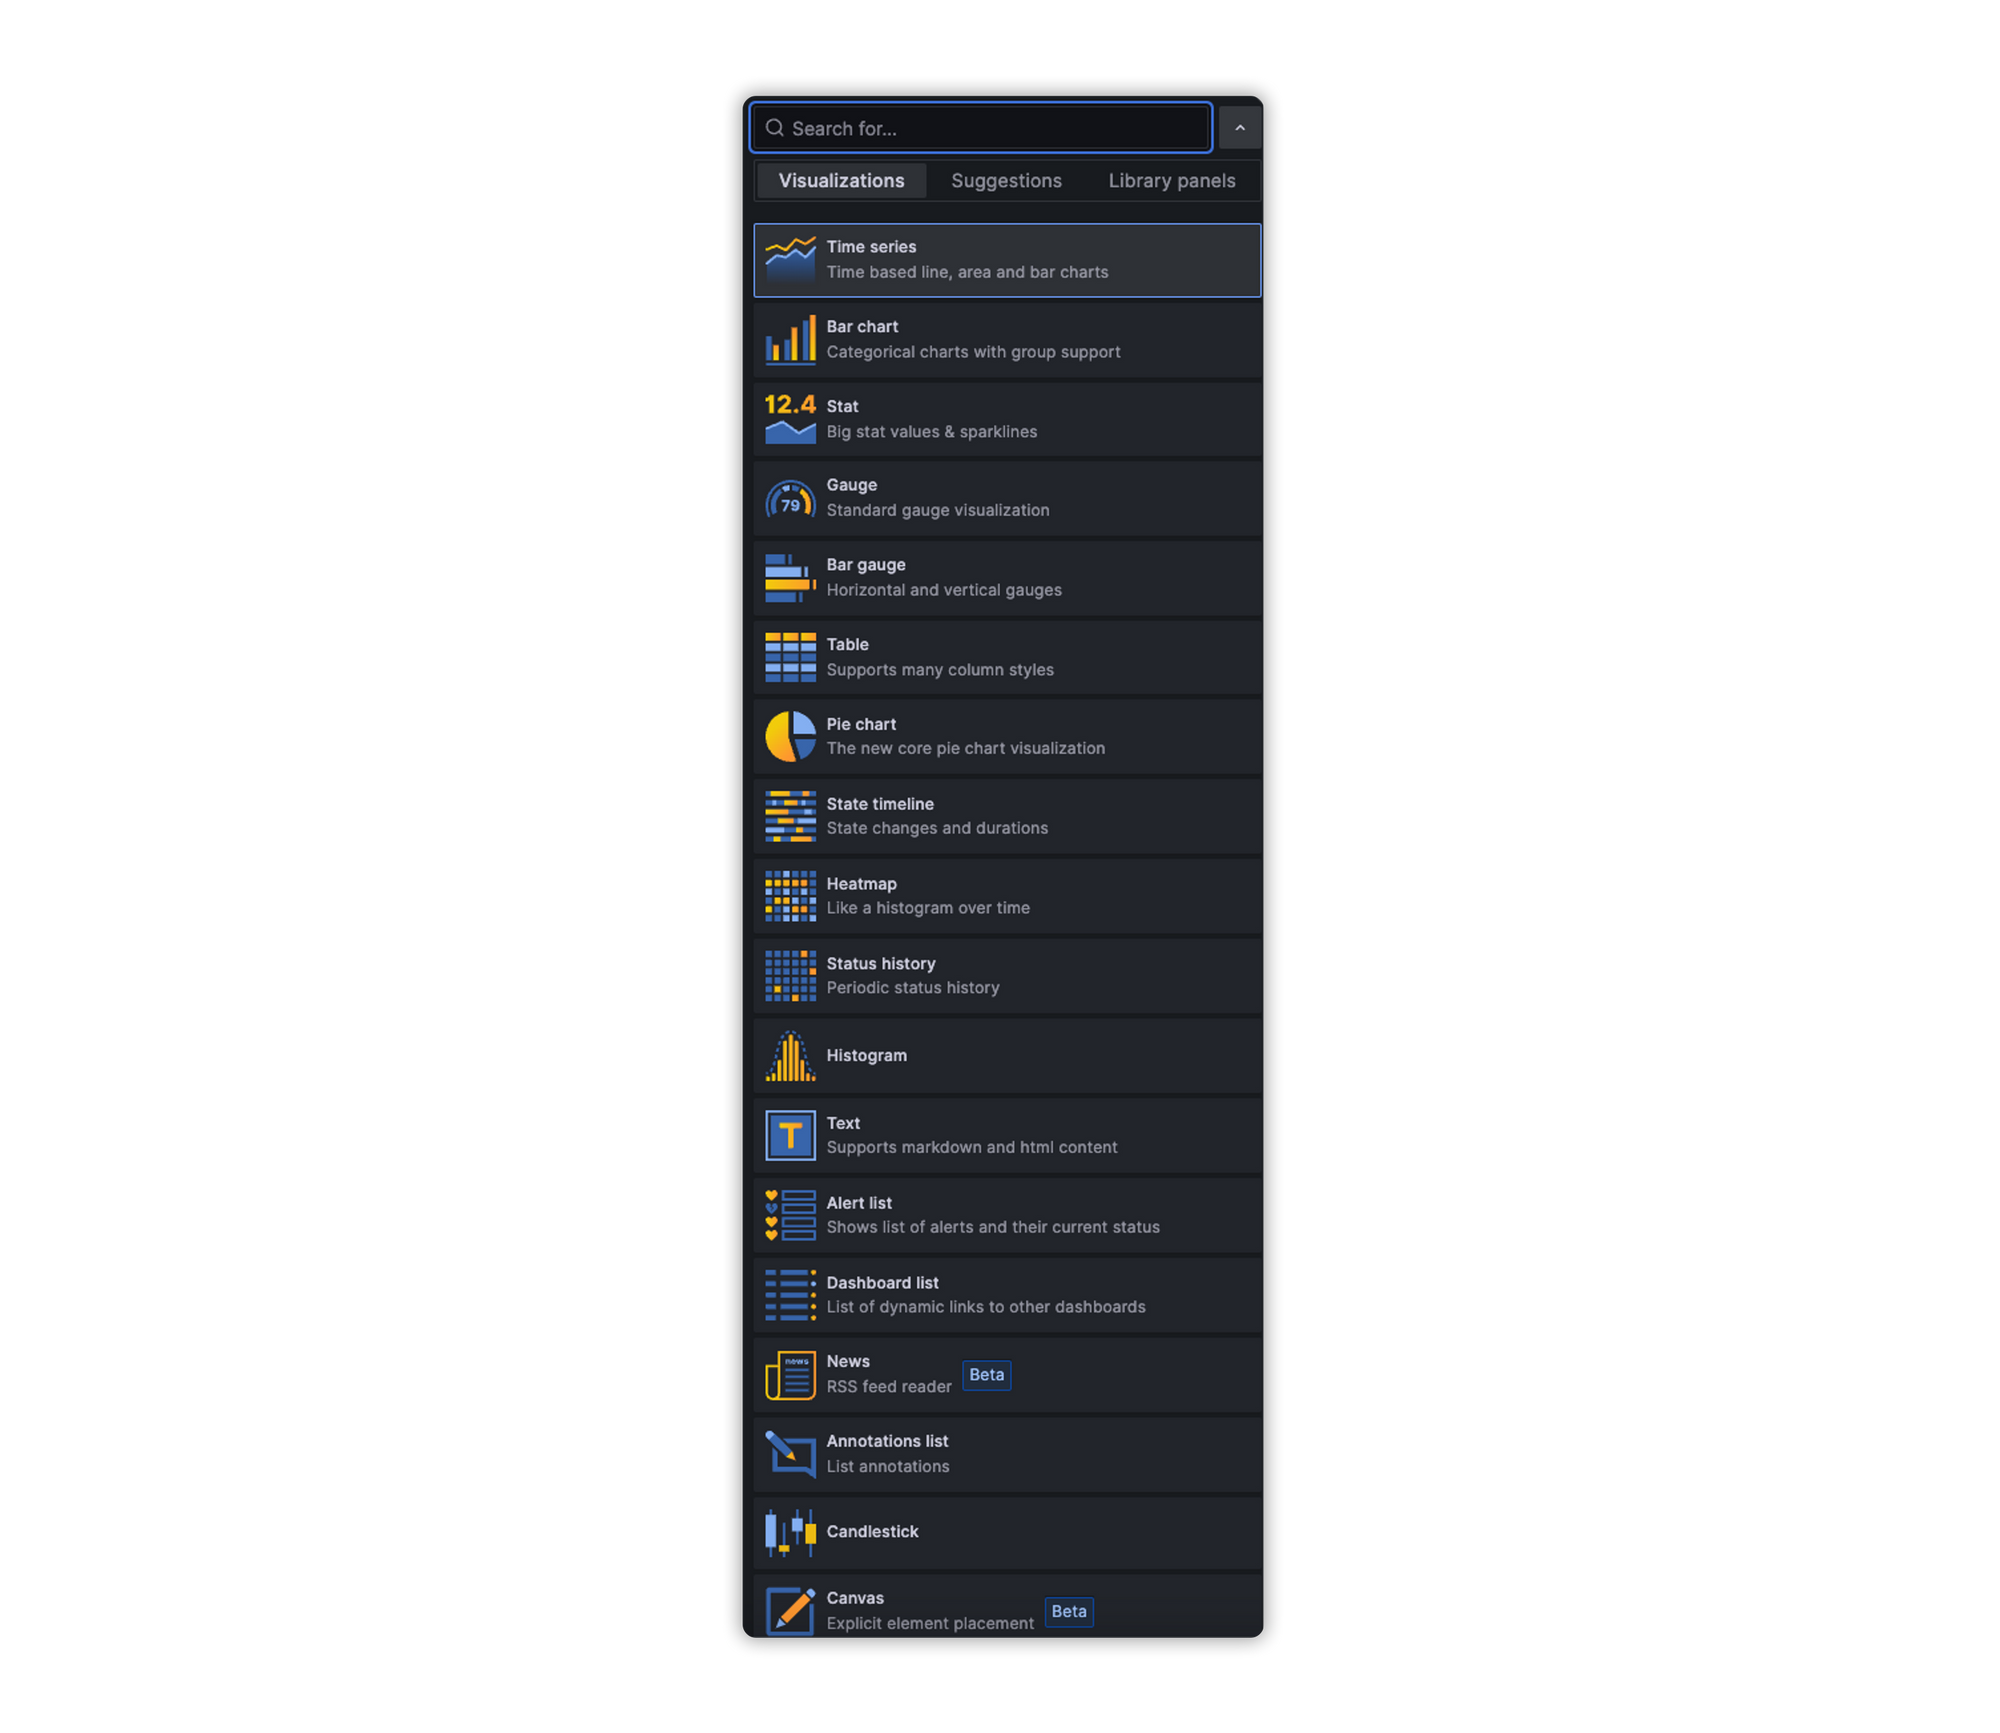
So, first, we need to pick the type of graph we want, Grafana offers us plenty of them.
For our example, we’re gonna pick Table, so the graph part is set now we need data to fill the table. For that, we’re gonna head to the button where our query build is set.
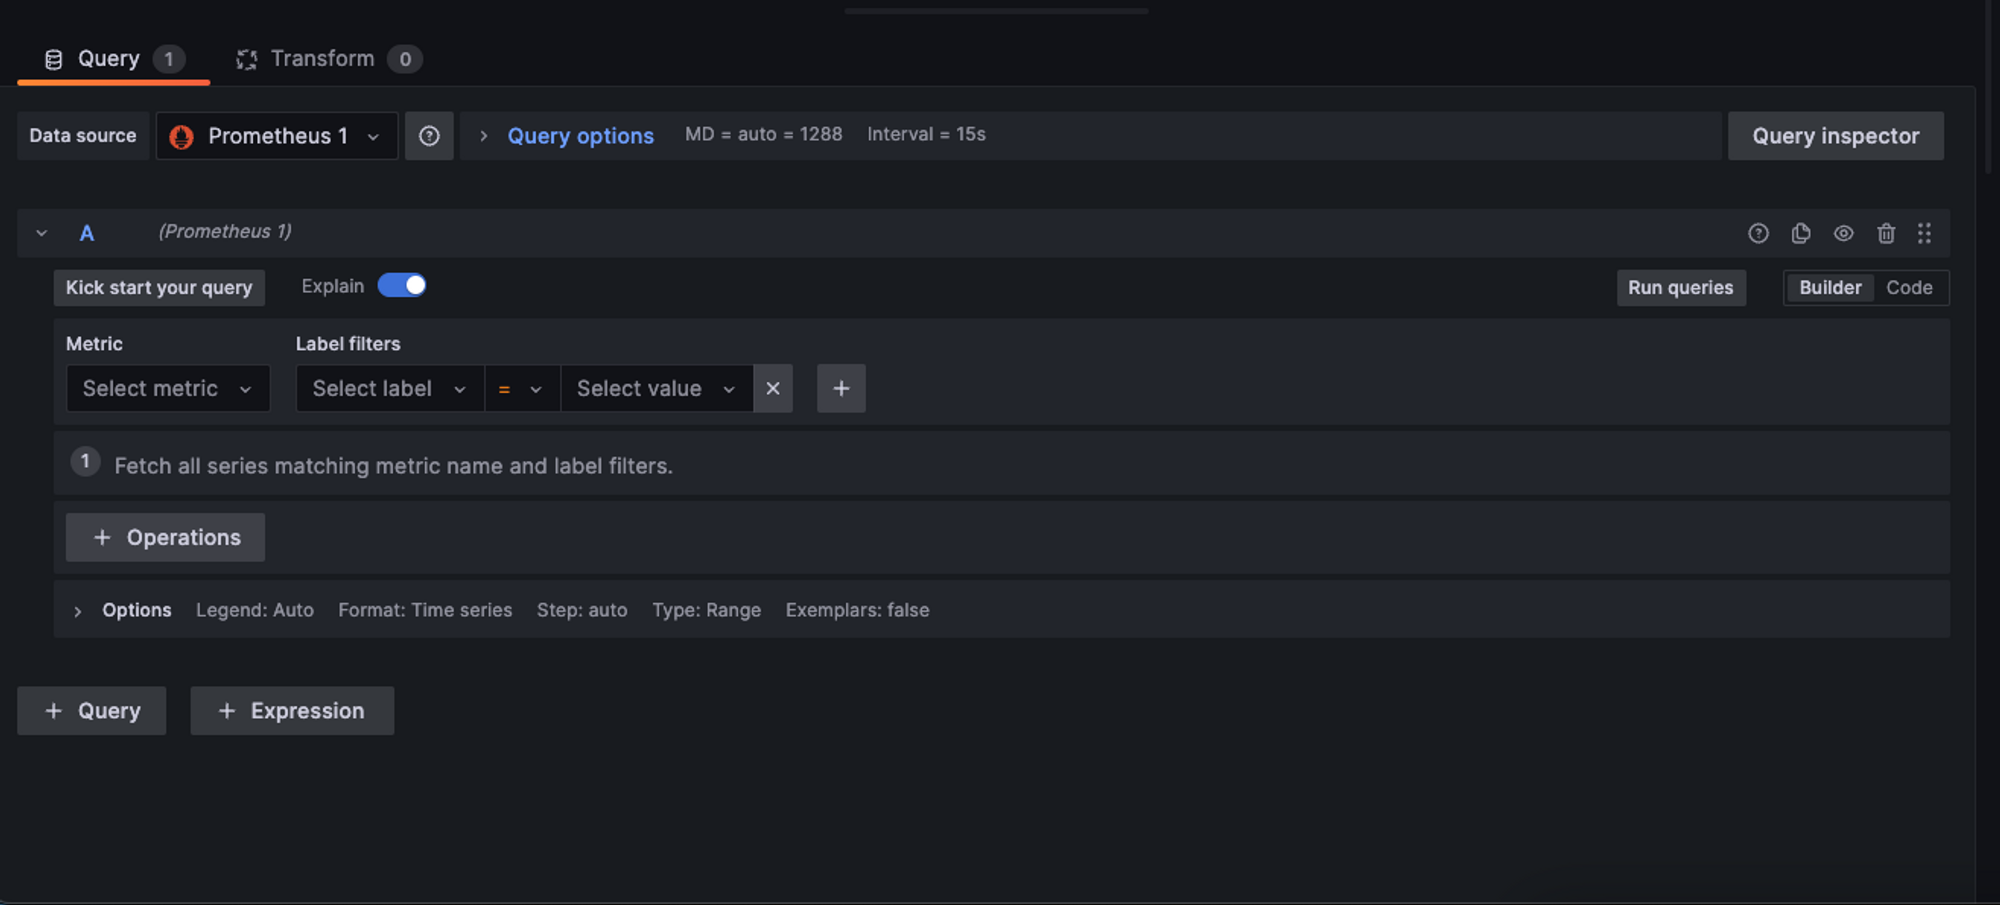
In the left part of this section, we can either pick query builder or plain code query, for this example, we’re gonna use the code query one.
Now, remember the query from earlier? We can basically use that exact query for our Grafana service to ask Prometheus for that data.
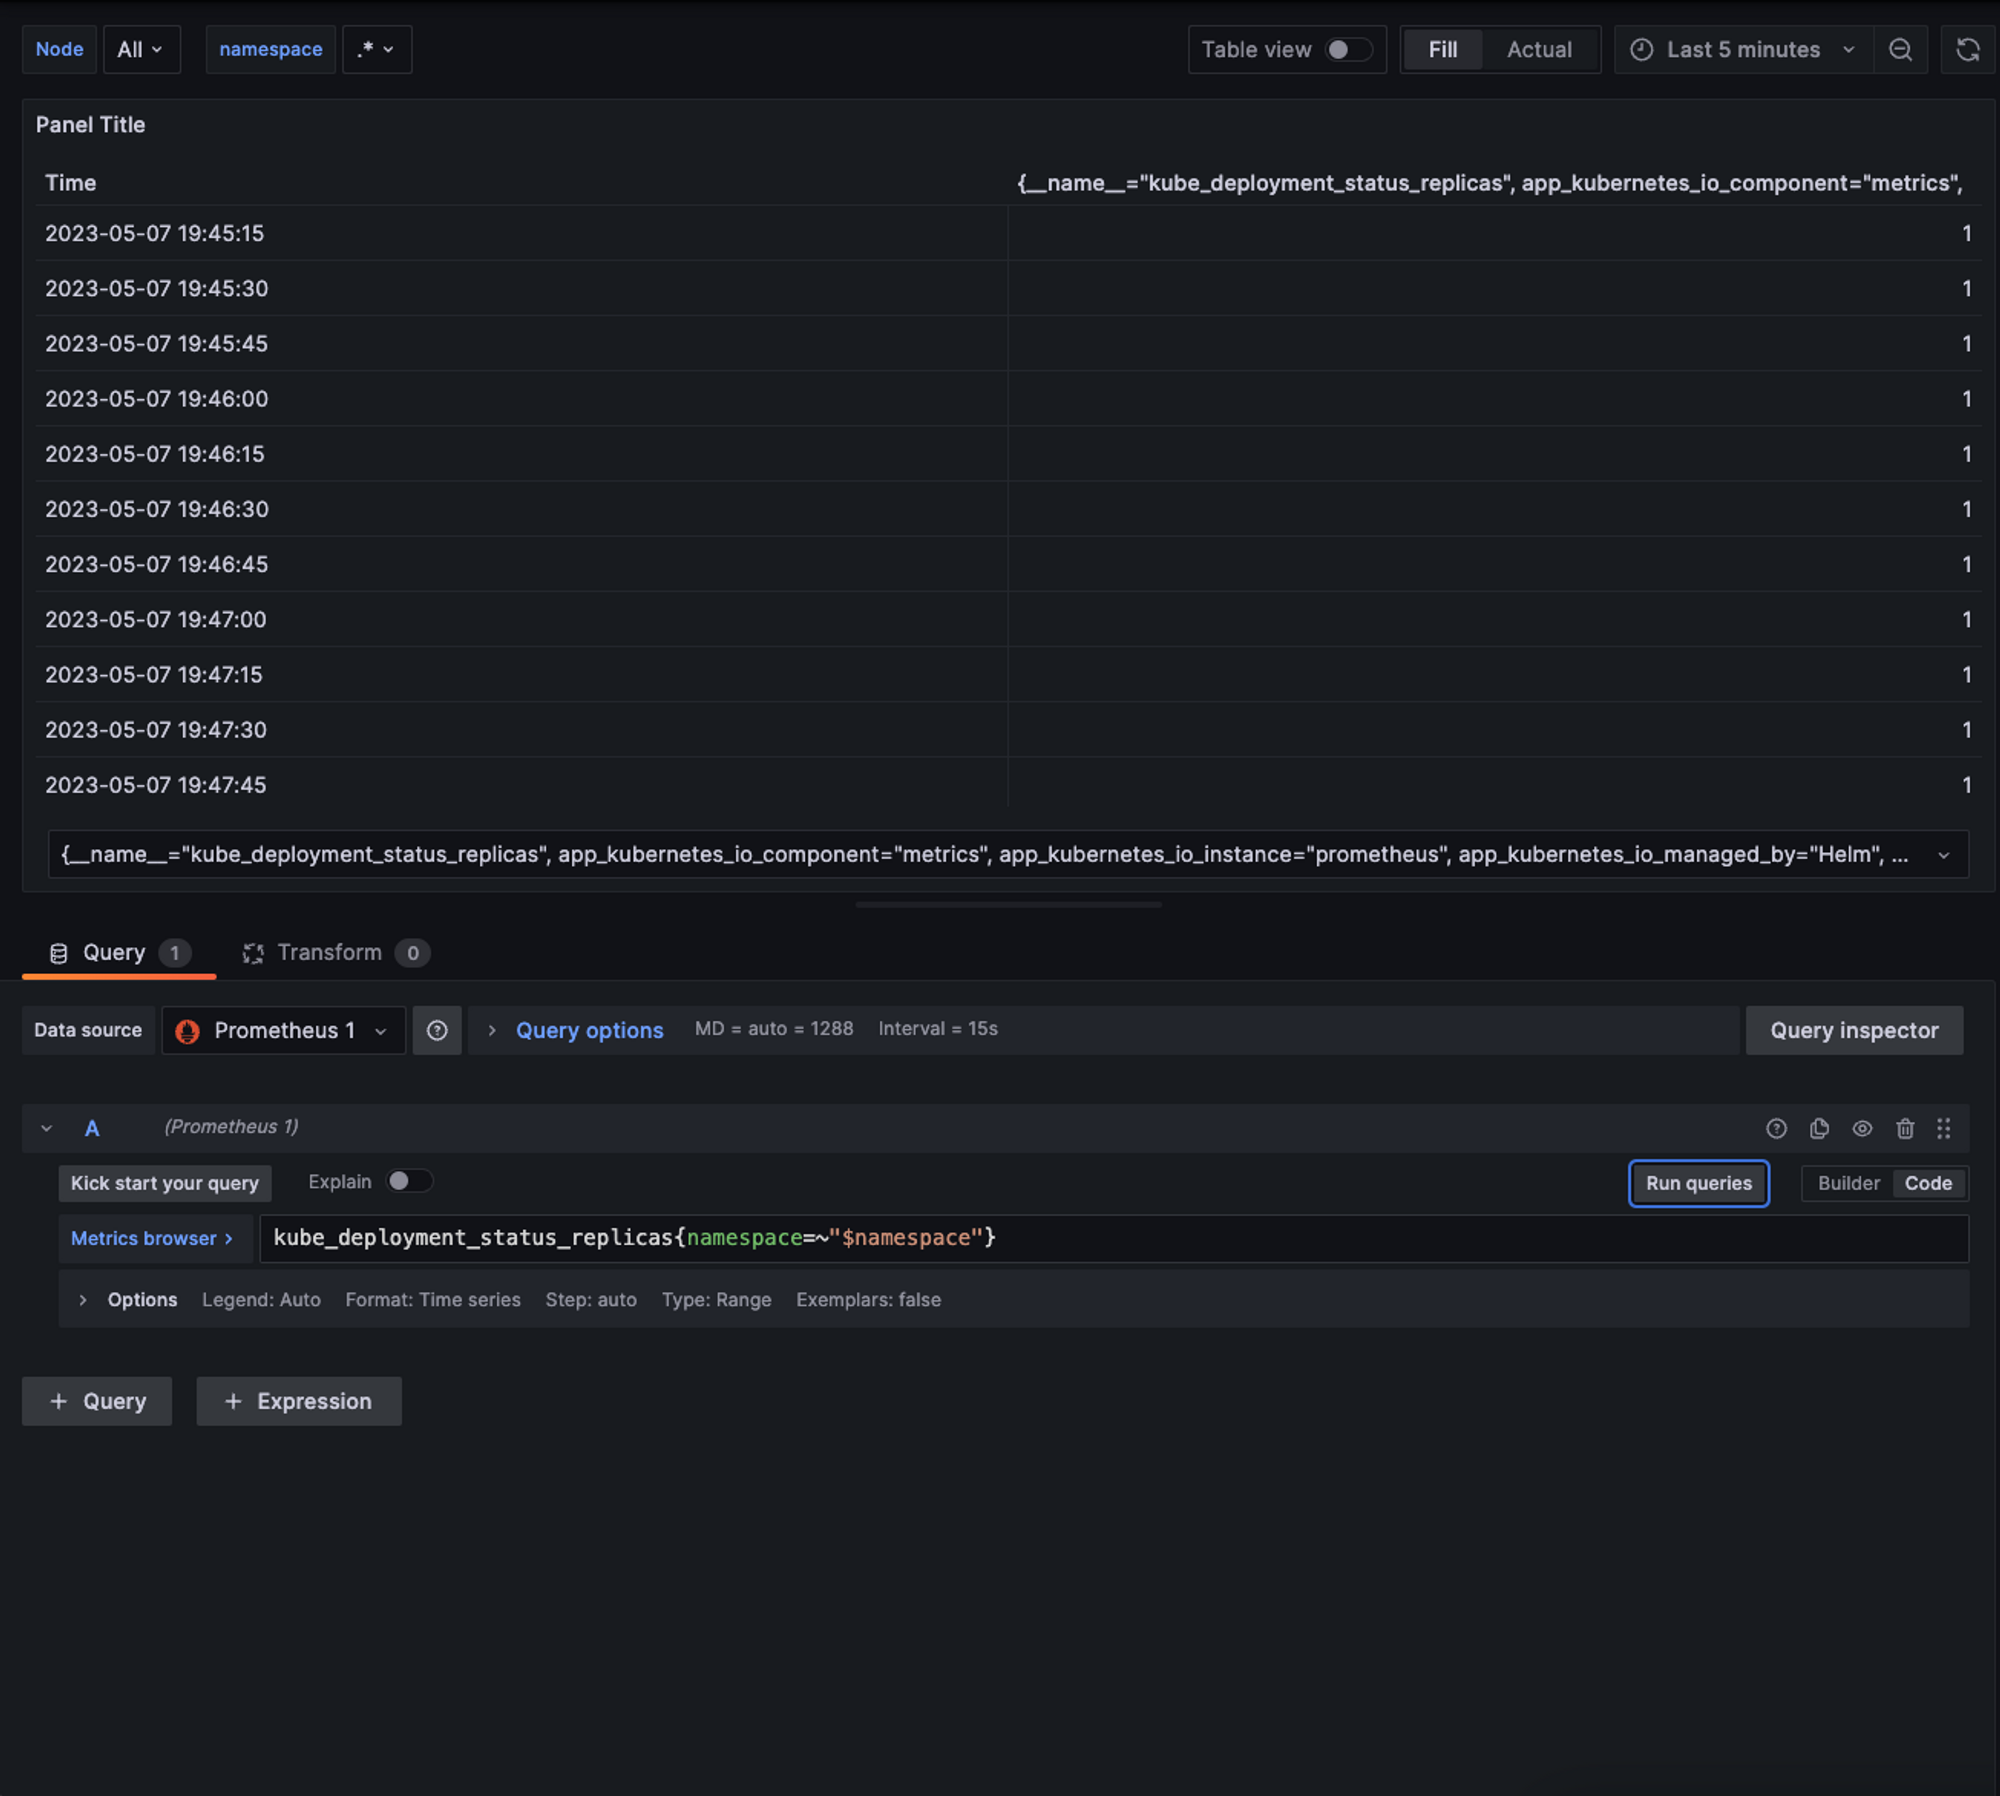
Here are two things to keep in mind here:
- As you can see we’re already retrieving data from Prometheus but it is not so meaningful for us so we will need to transform it and tweak it in order to use it.
- In our query instead of
.*we are using$namespacethis is how we use the variable that we created earlier, so our graph que be dynamically changed.
For our first point, we’re gonna transform it. We’ll go to the transform tab and you can see that Grafana already offer us quite a few ways to transform the data for all kind of purposes, the one that we are gonna use is Series to row and we will see how our table has changed.
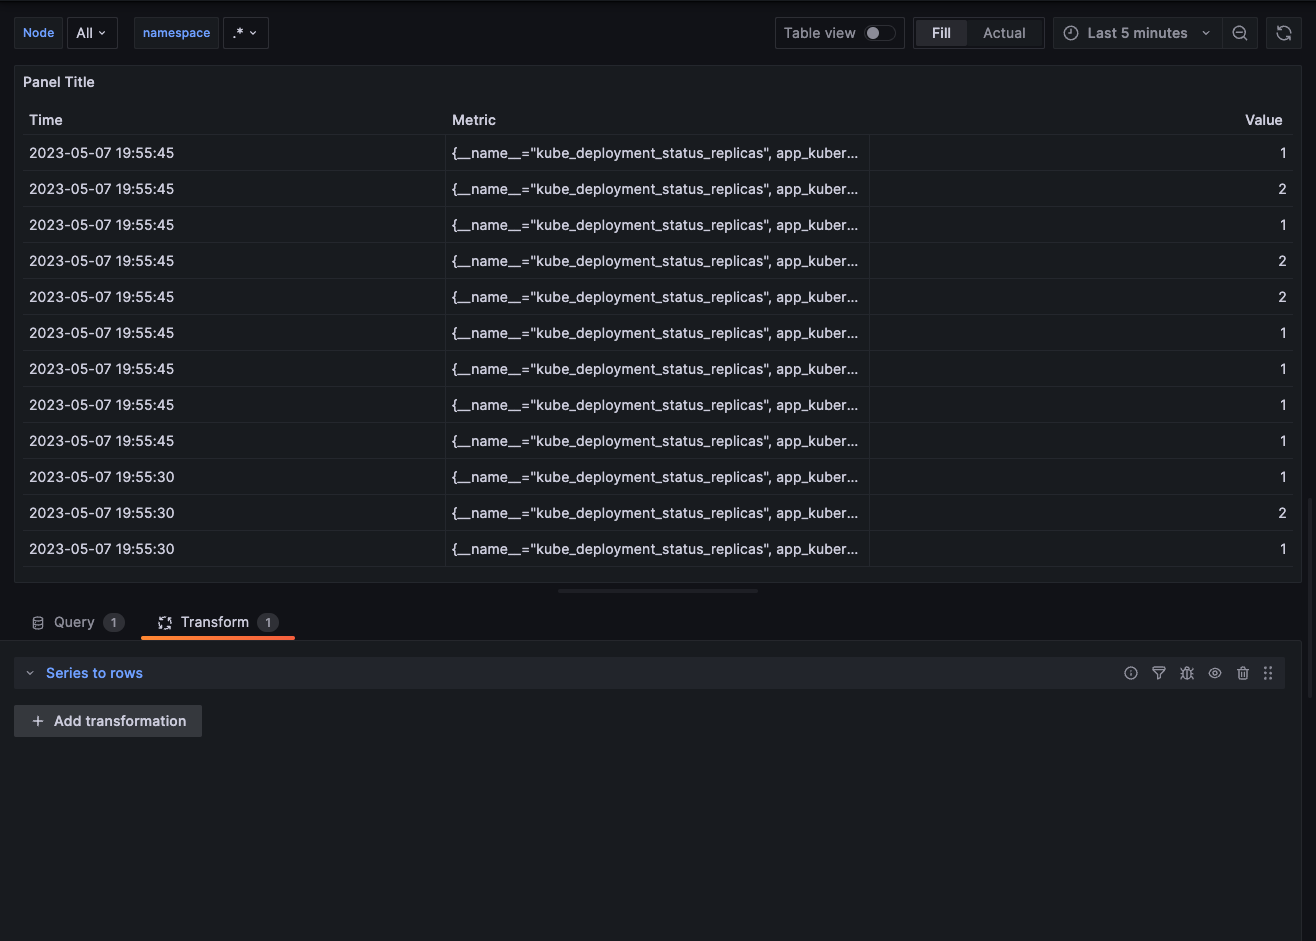
Now is looking better but we need one more thing, the metric column is still not so meaningful for us. We will go back to the query tab and head to options.
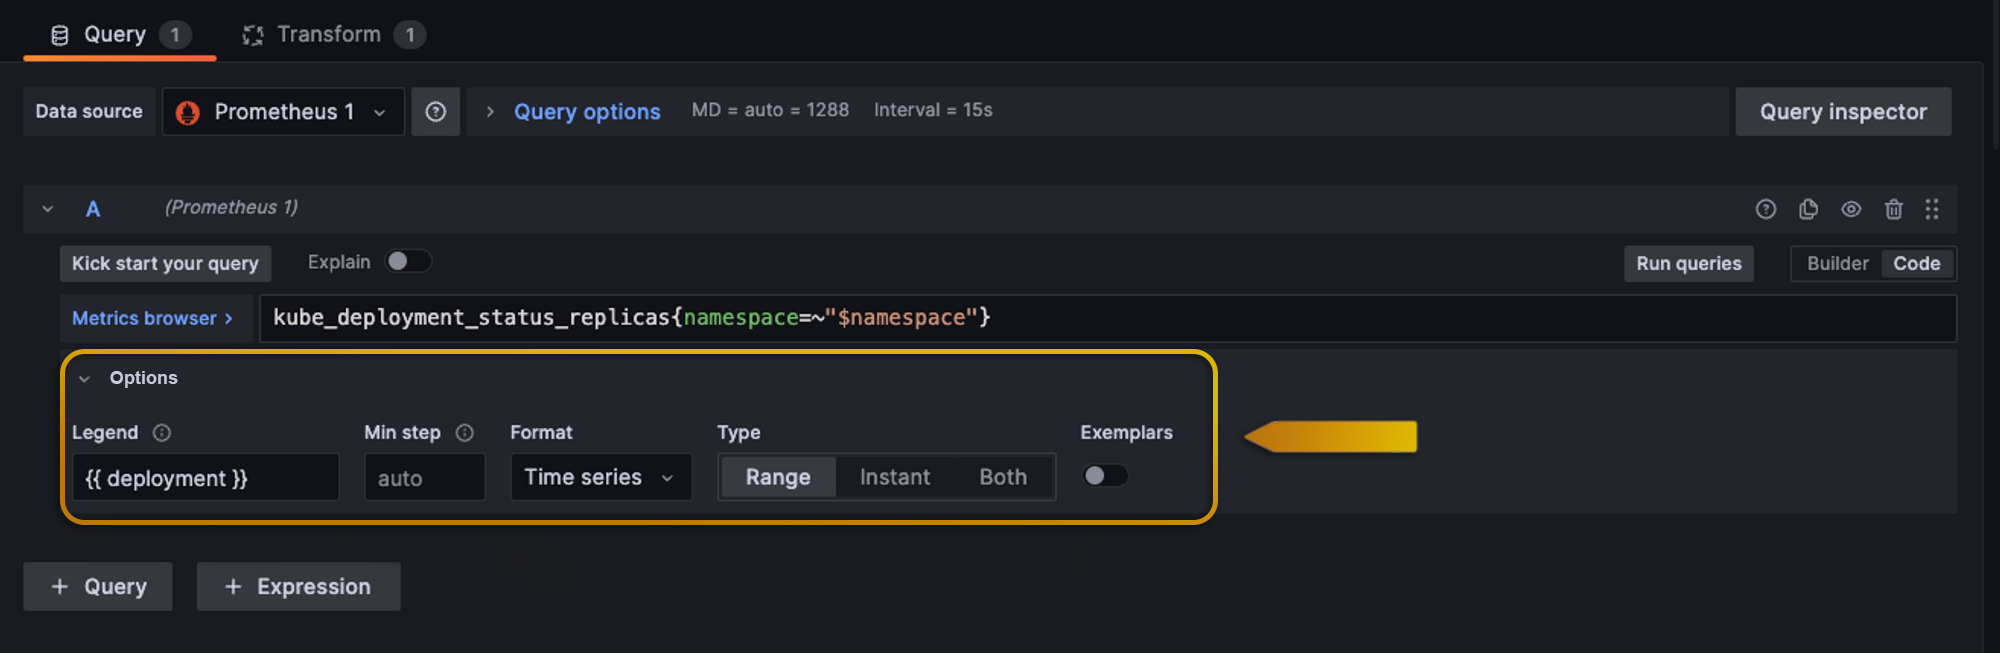
We’re gonna change the Legend option and we are gonna select the one that we need which is the deployment name and there you go, now we have something like this:
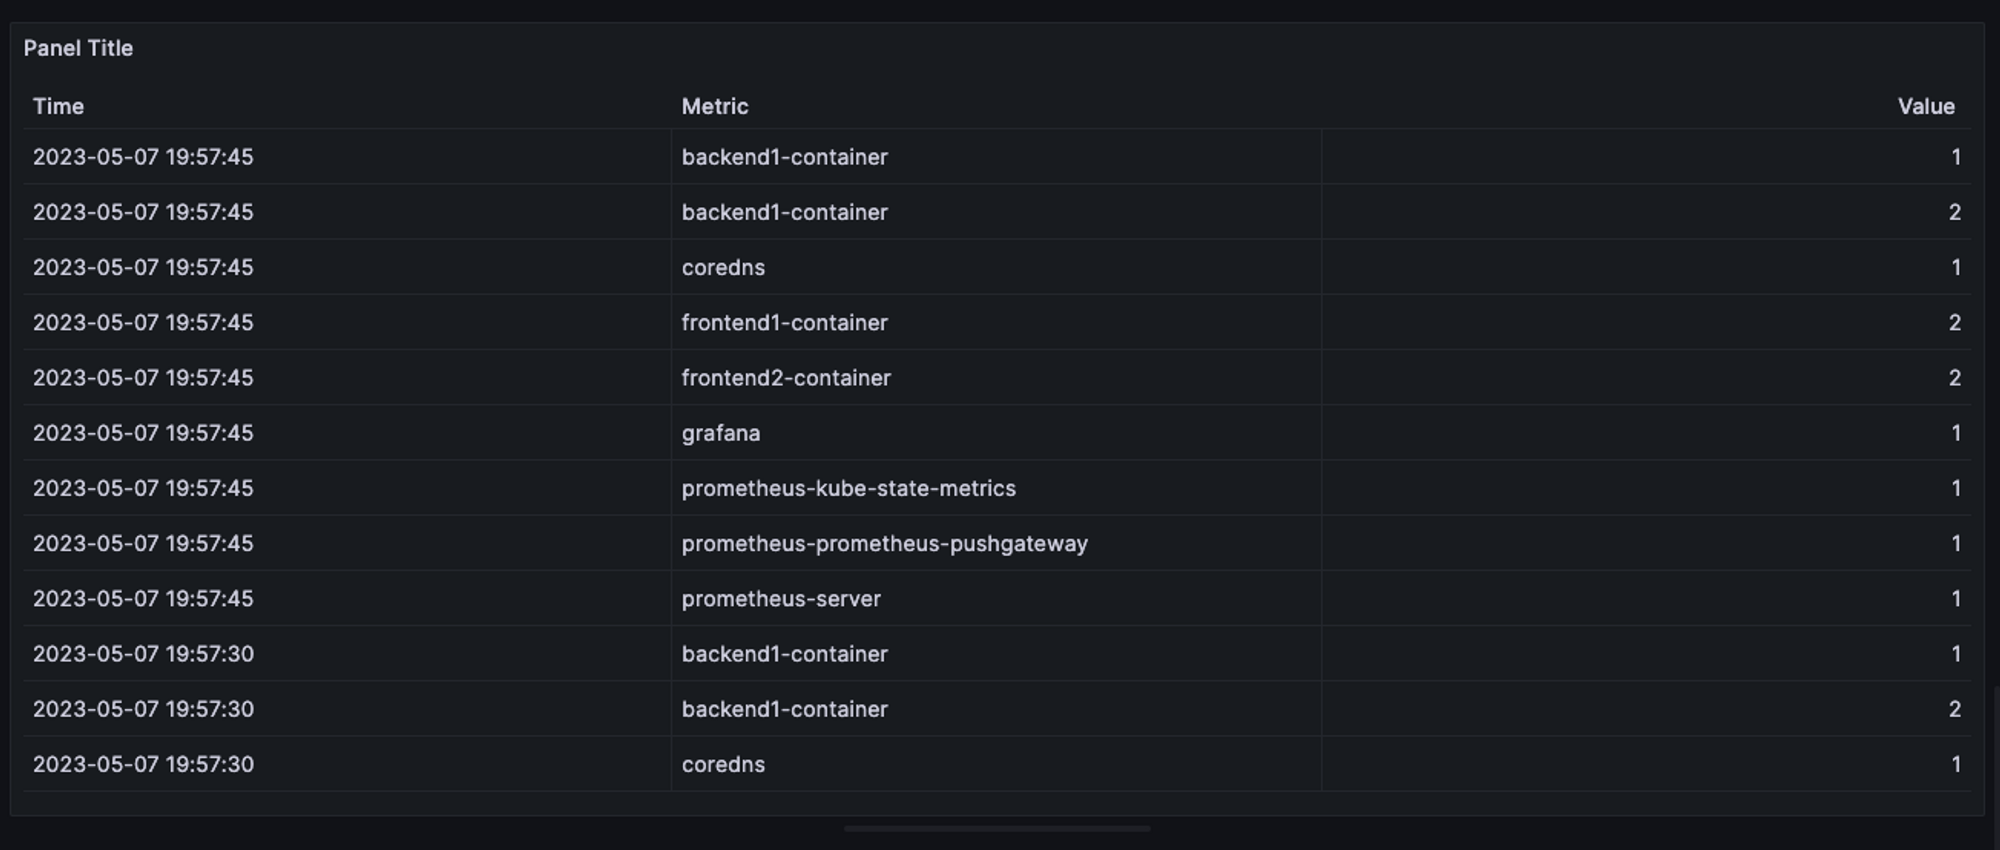
Now we can click Apply and now we can see that graph on our dashboard.
Observability has emerged as an essential capability for organizations in today's software development and operations landscape, contributing to delivering more reliable and high-performing software systems. To achieve this, teams can leverage powerful tools like Prometheus and Grafana, empowering them to continuously monitor system behaviors.
As software systems grow increasingly complex, the ability to observe and understand the inner workings becomes invaluable for organizations. Through observability, they can gain valuable insights into their infrastructure and applications' internal state and behavior, allowing them to optimize performance, streamline operations, and provide users with a better experience. The benefits of observability are far-reaching, enabling organizations to stay ahead of the curve and ensure their software systems operate at their best.